
Century 21 People’s Choice Realty Inc., Brokerage
120 MATHESON BLVD E #103
MISSISSAUGA, Ontario
L4Z 1X1
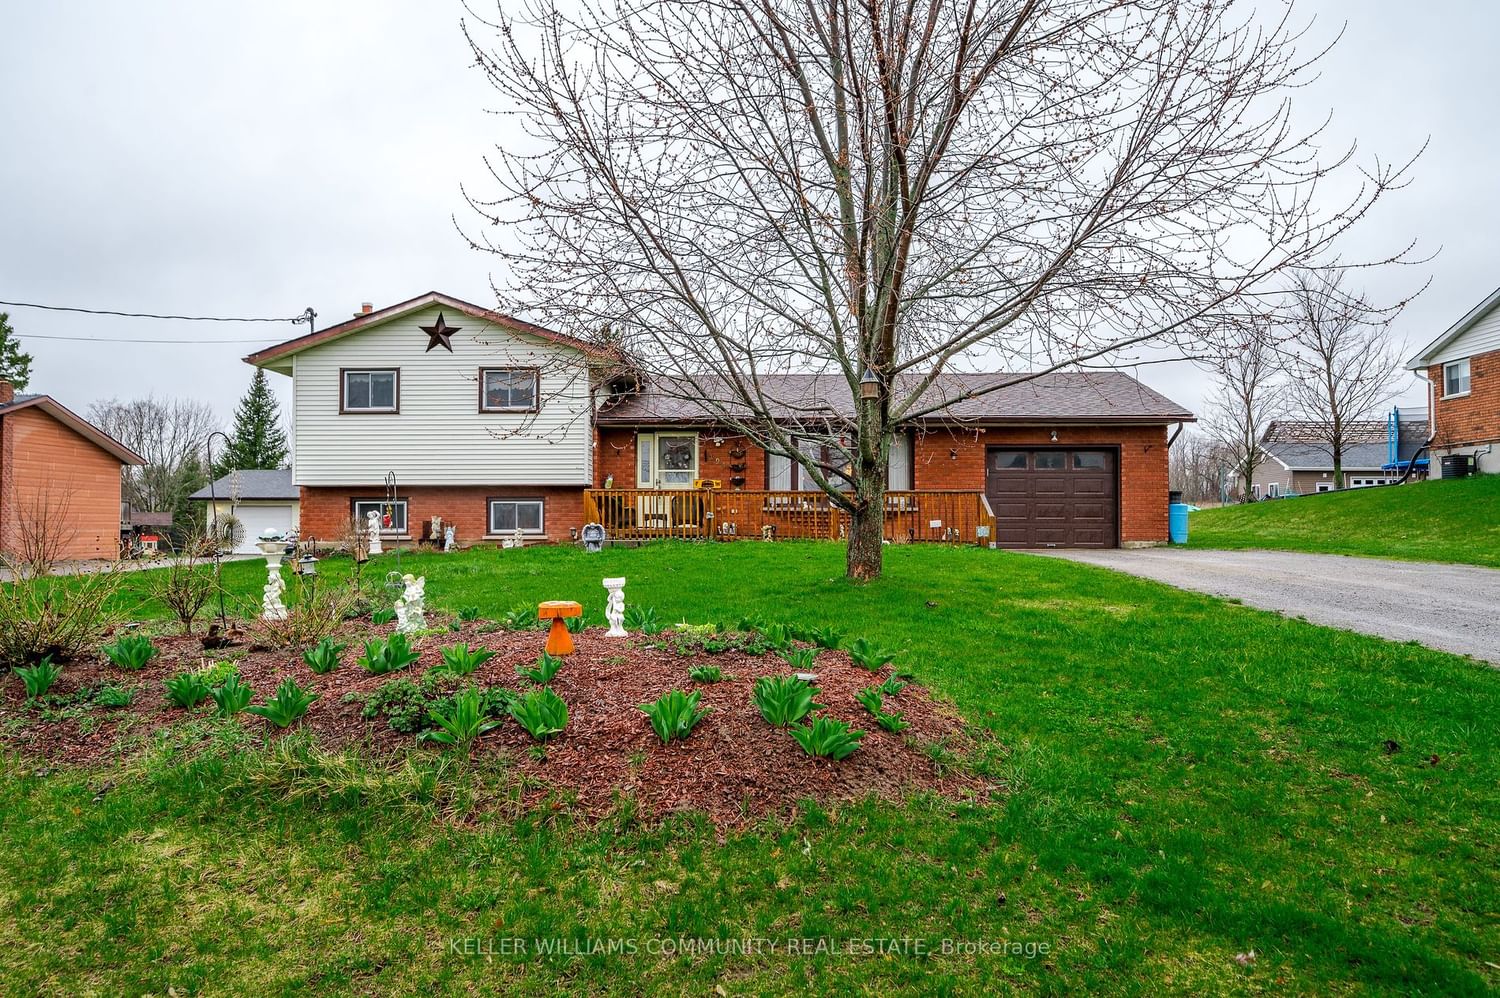
Kawartha Lakes, Bobcaygeon, K0M 1A0
$855,868$000000
Listed by ROYAL HERITAGE REALTY LTD..
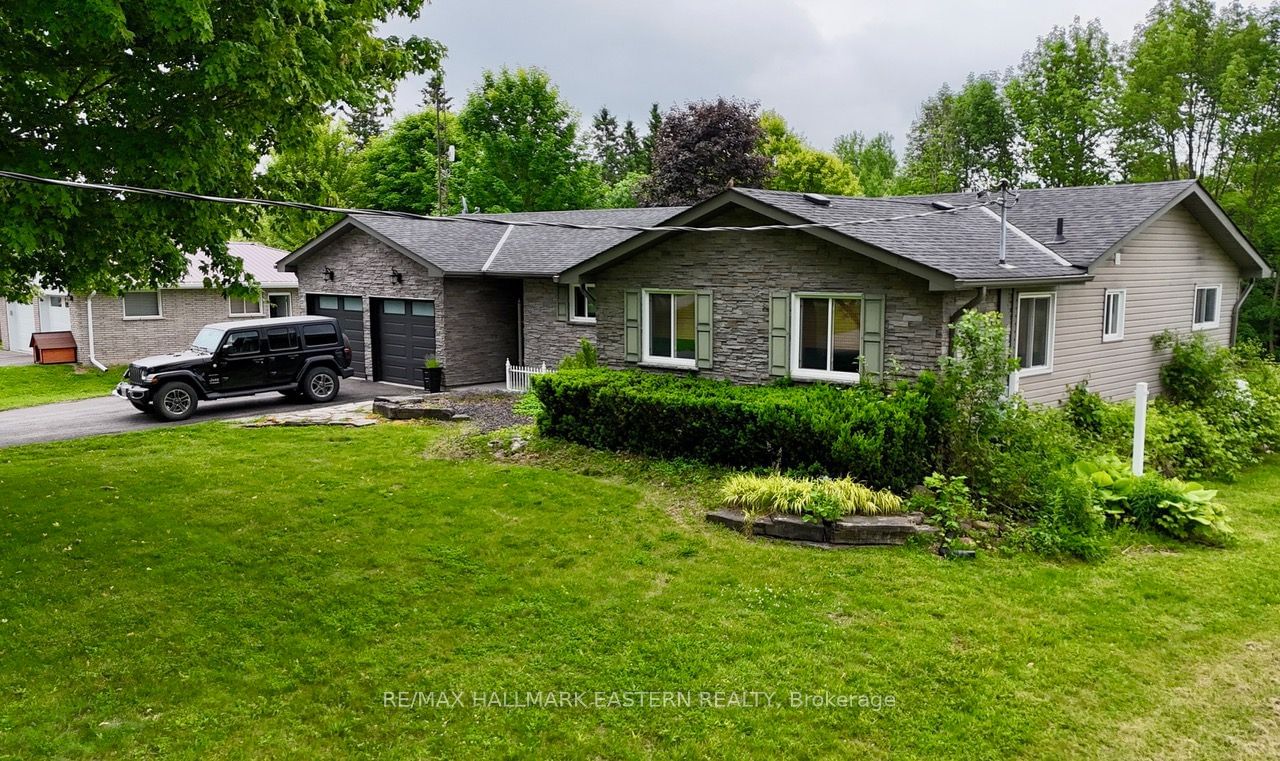
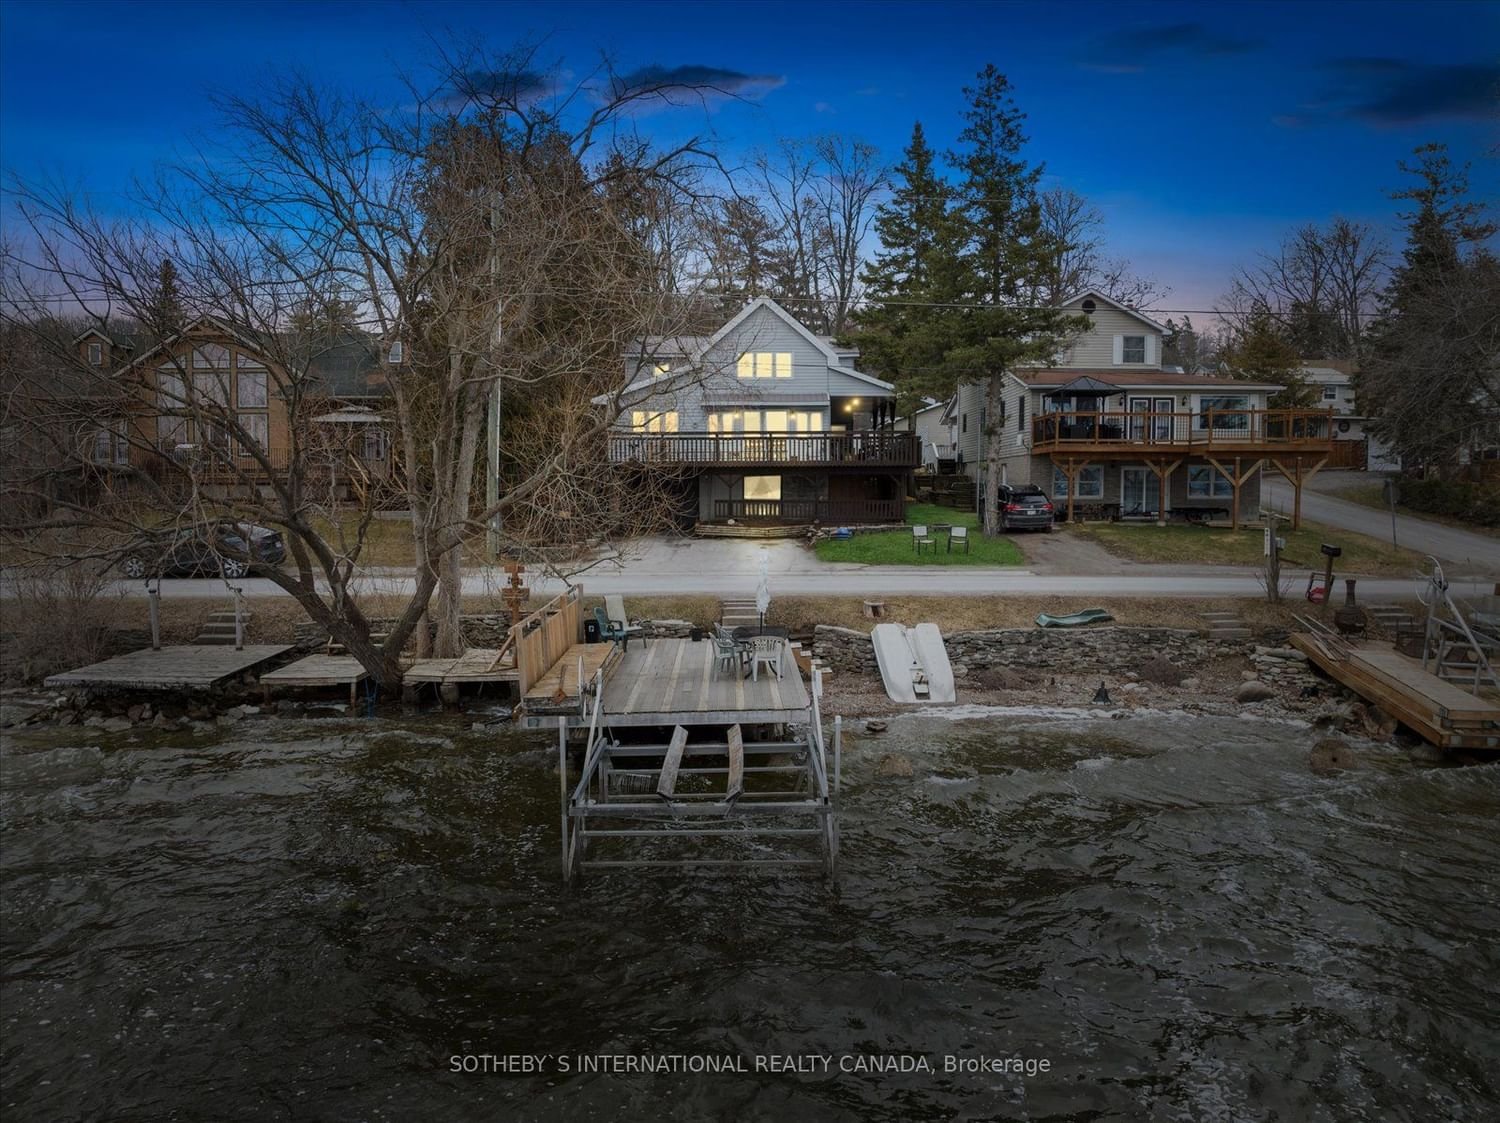
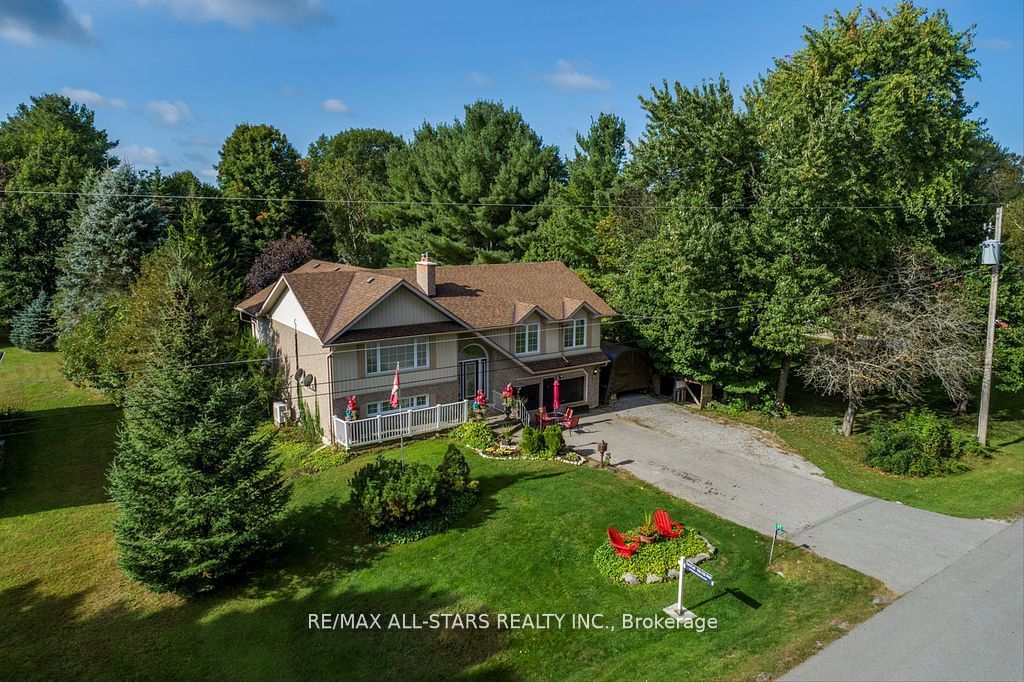
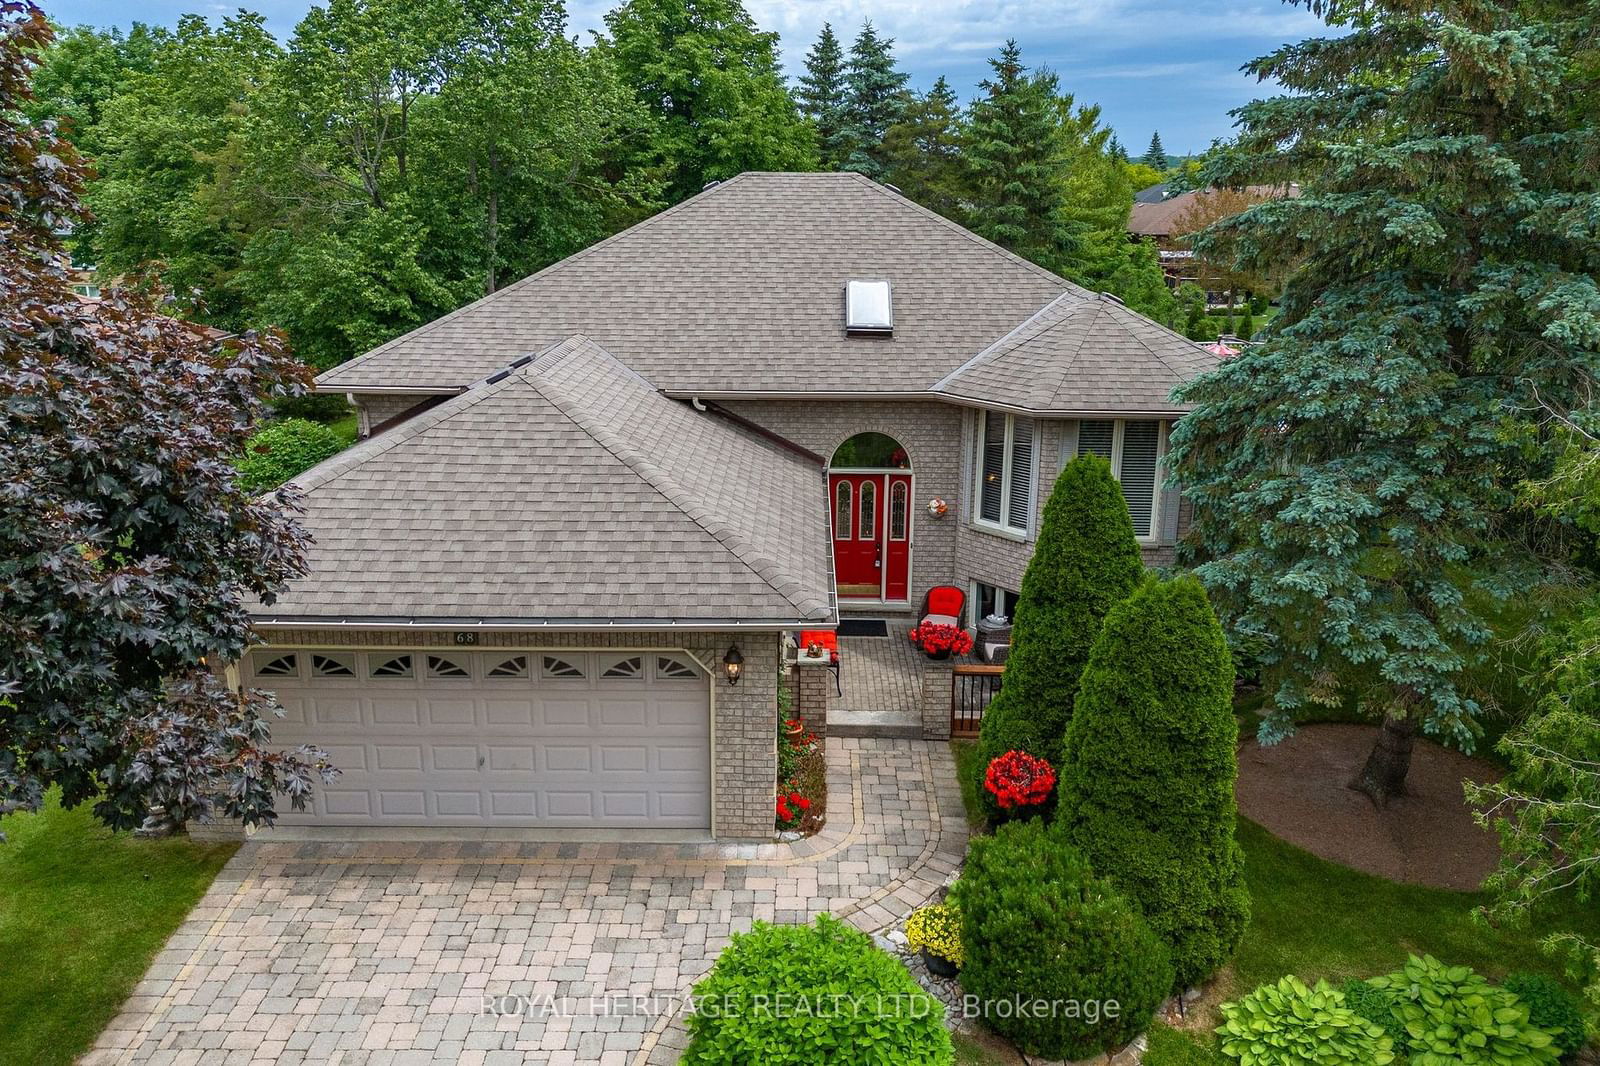
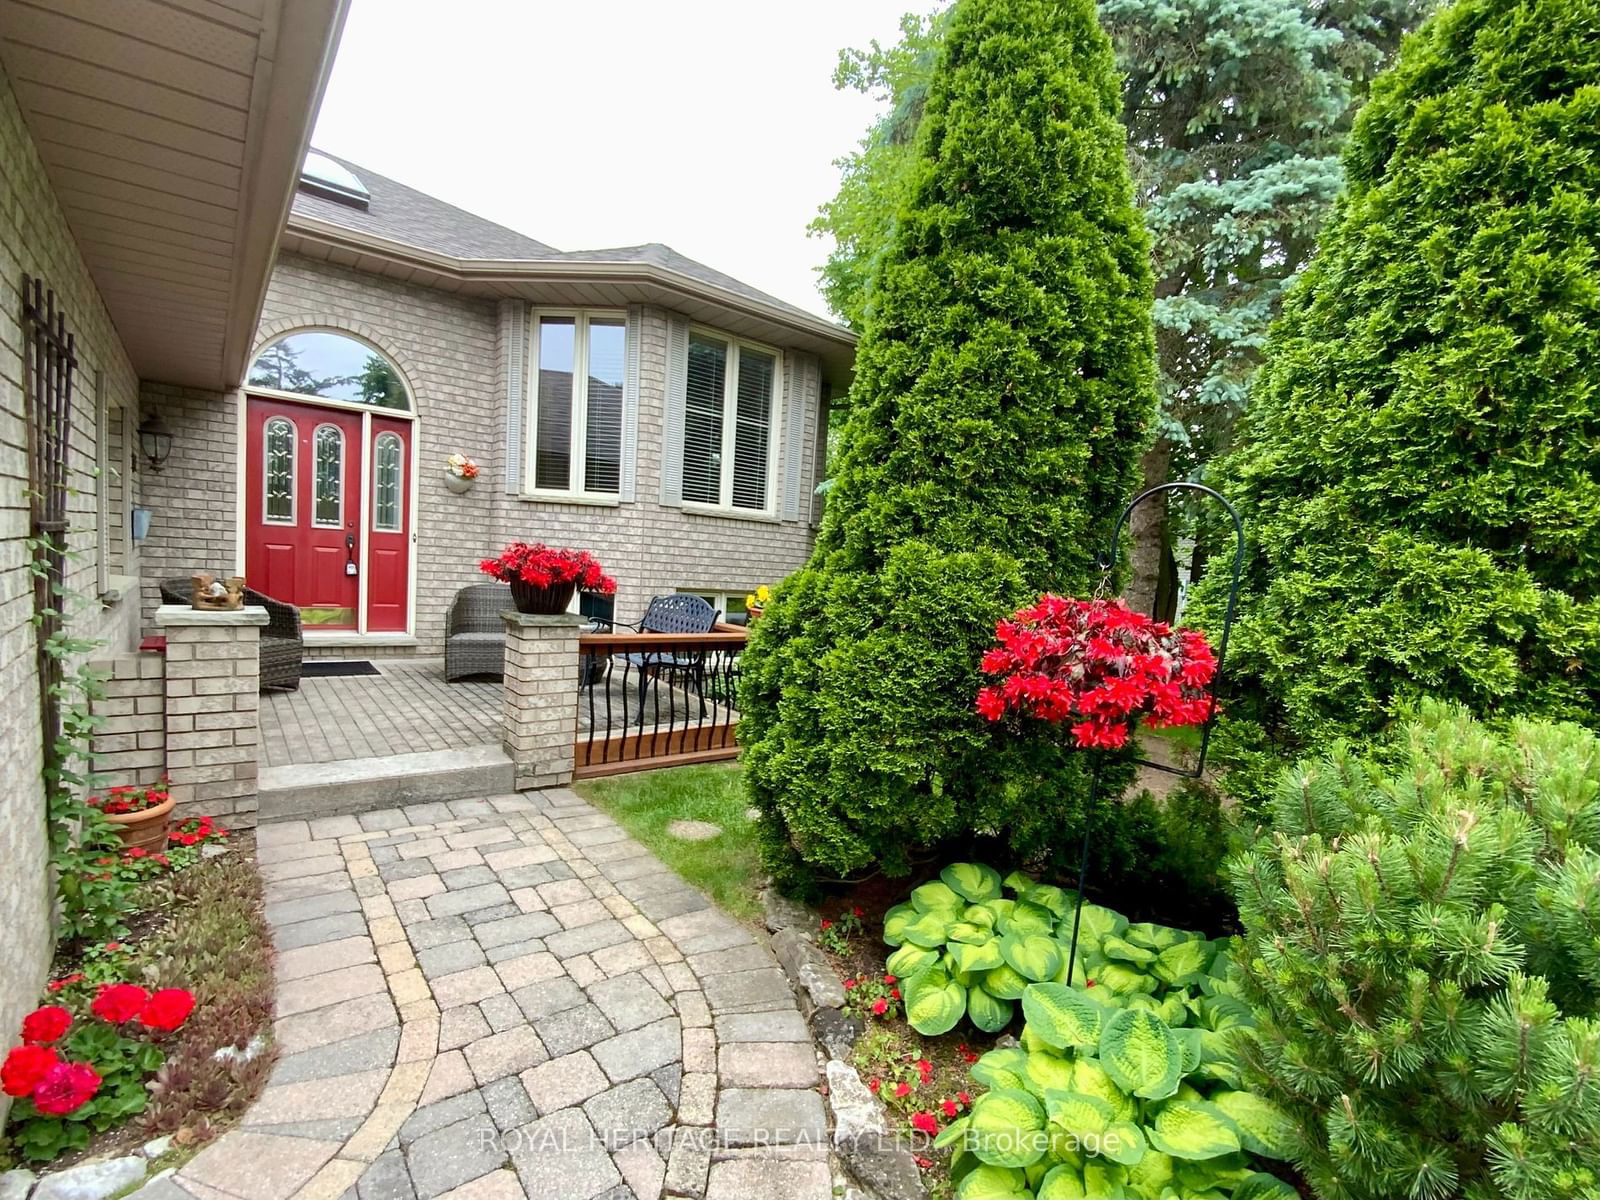
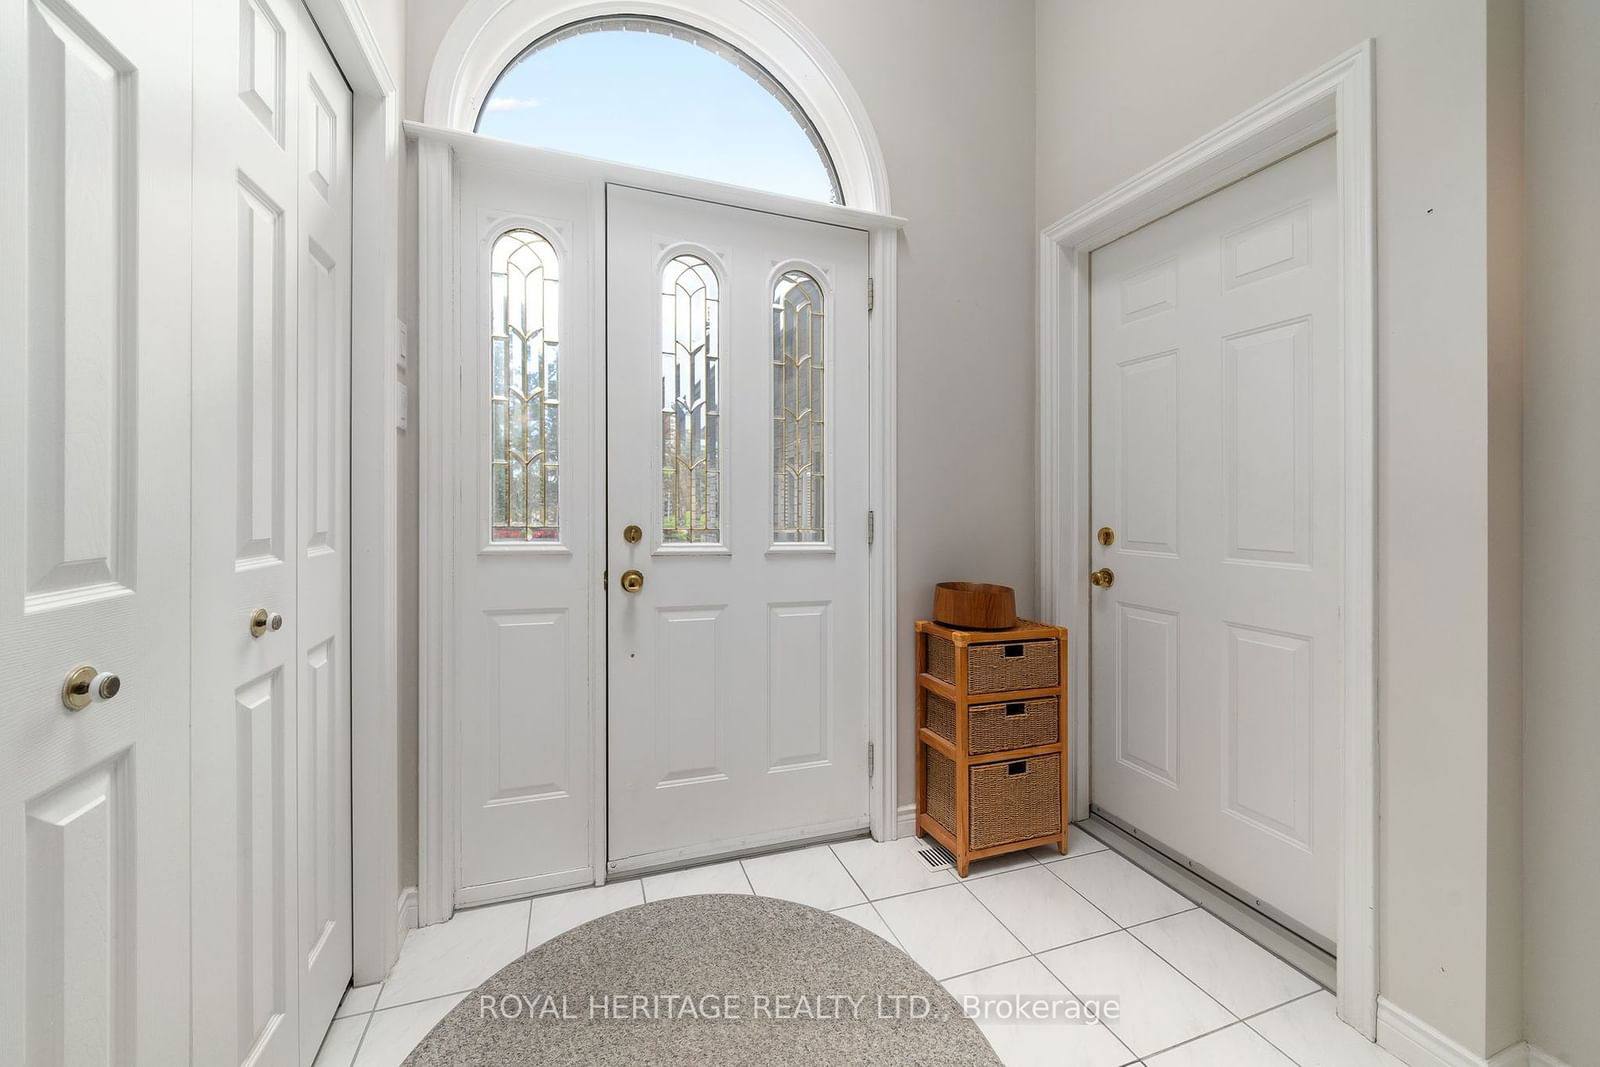
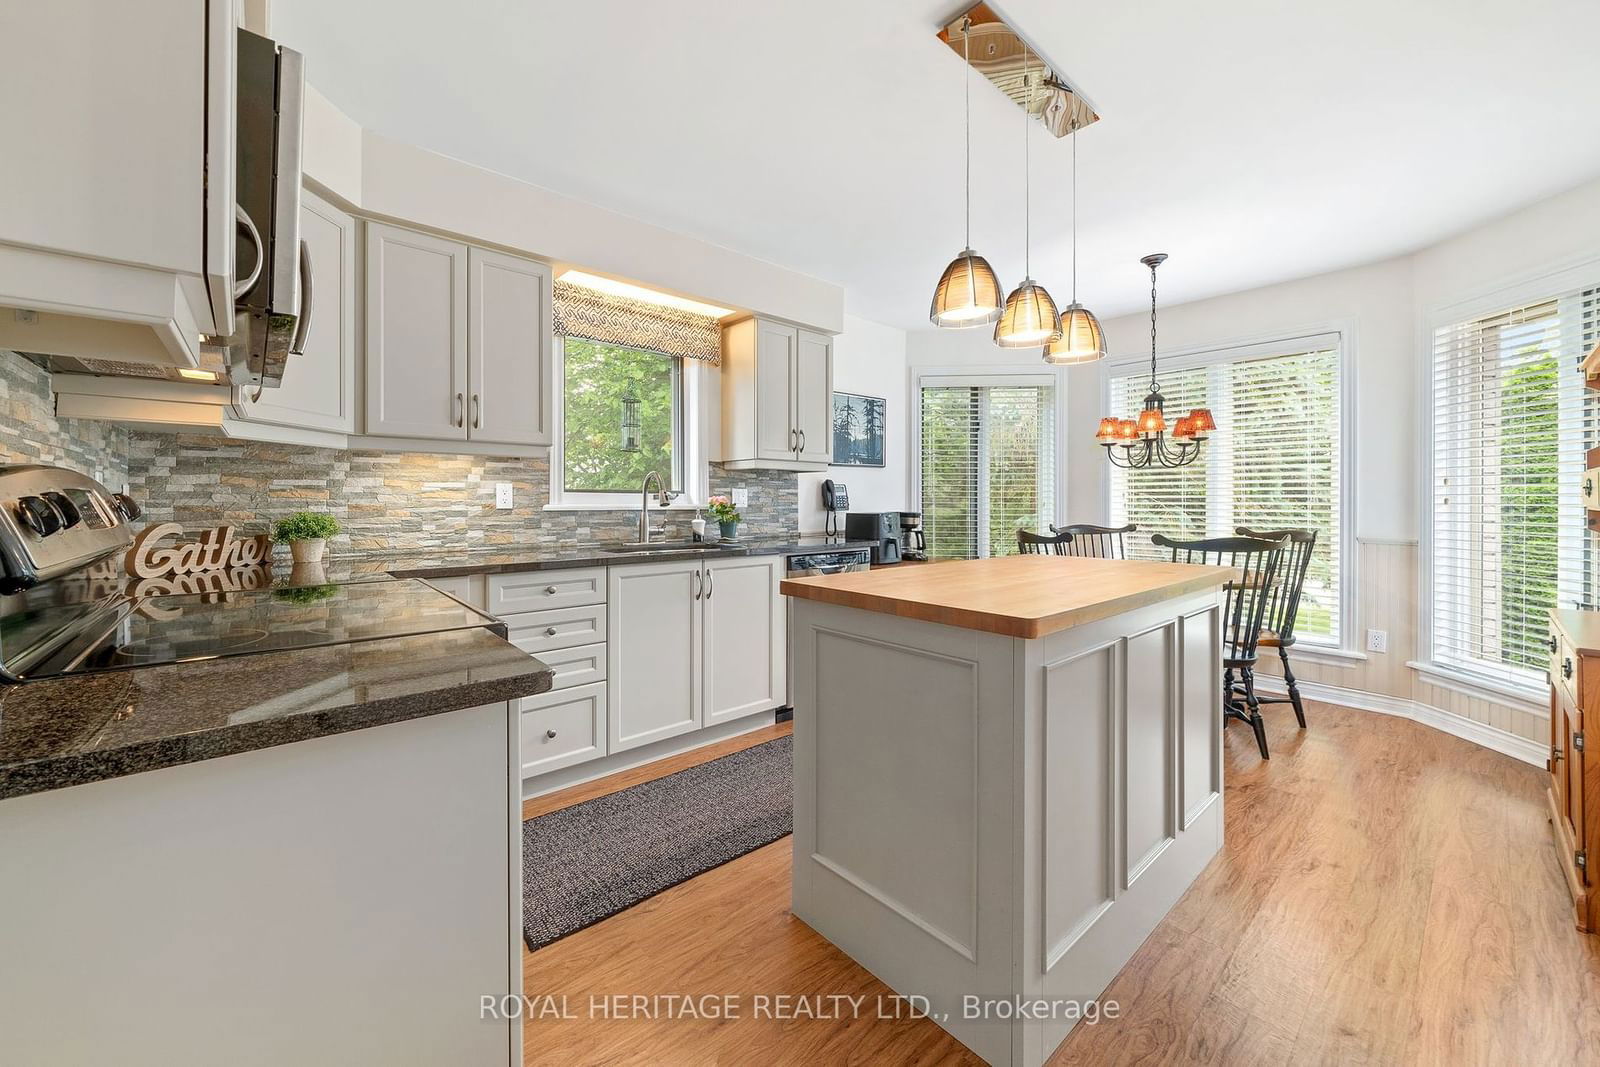
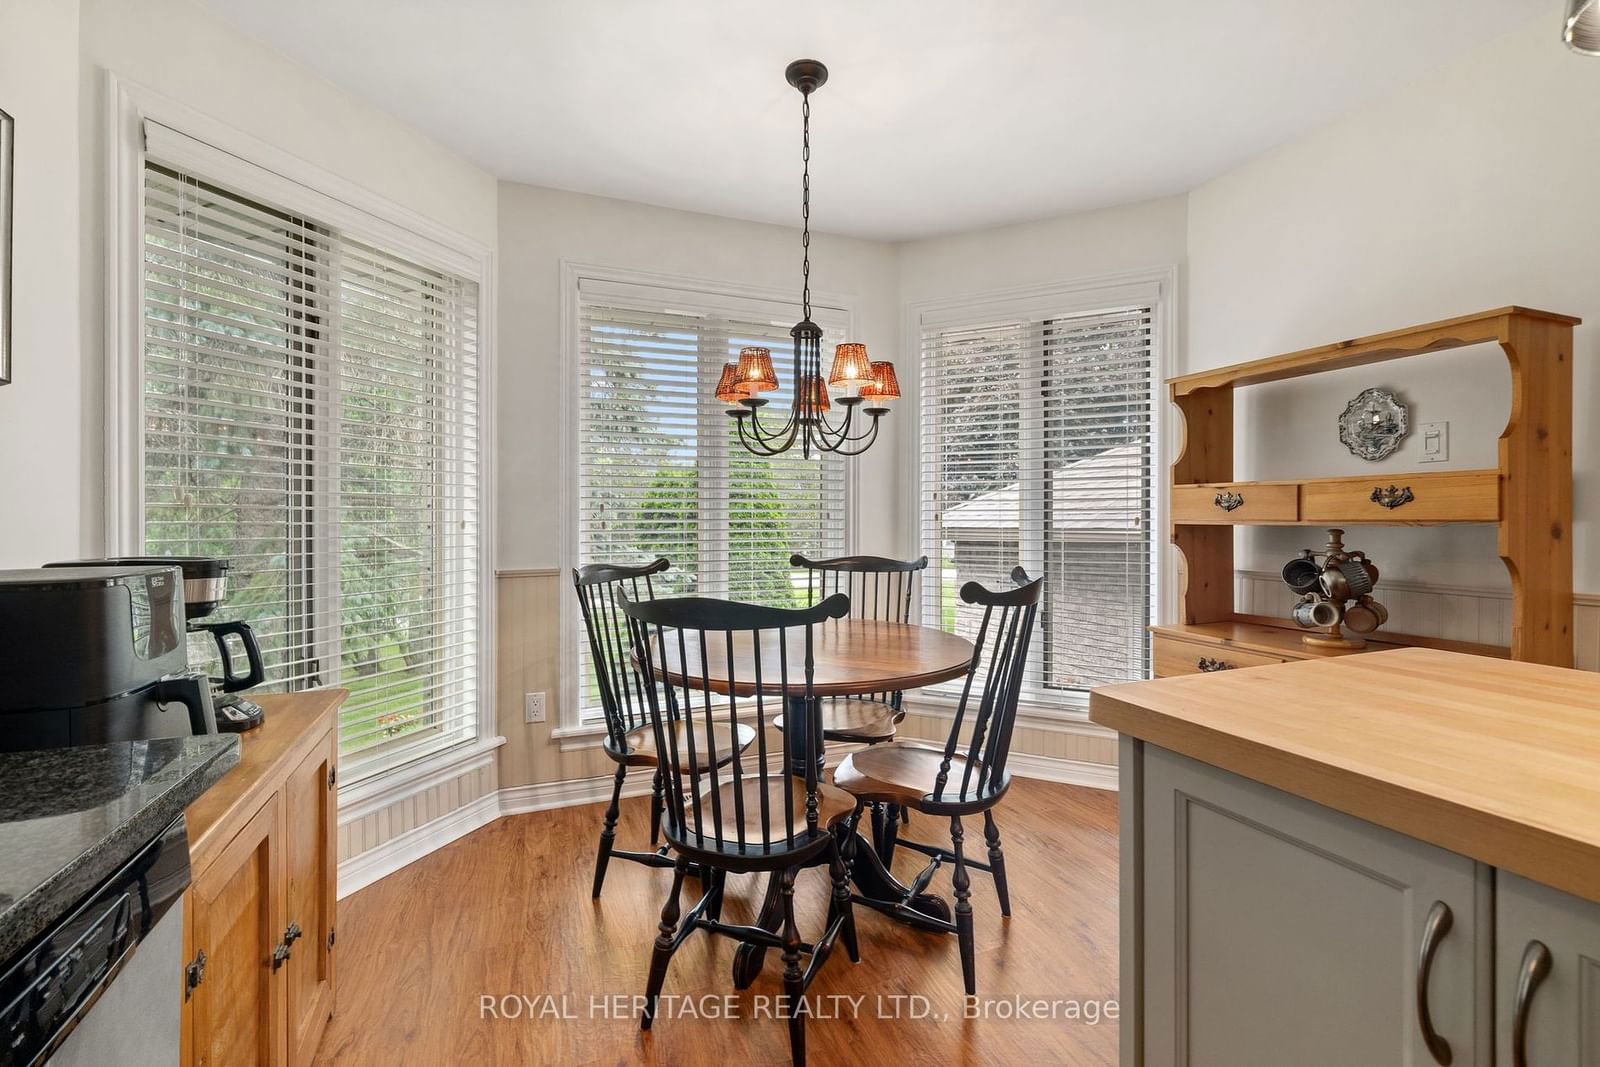
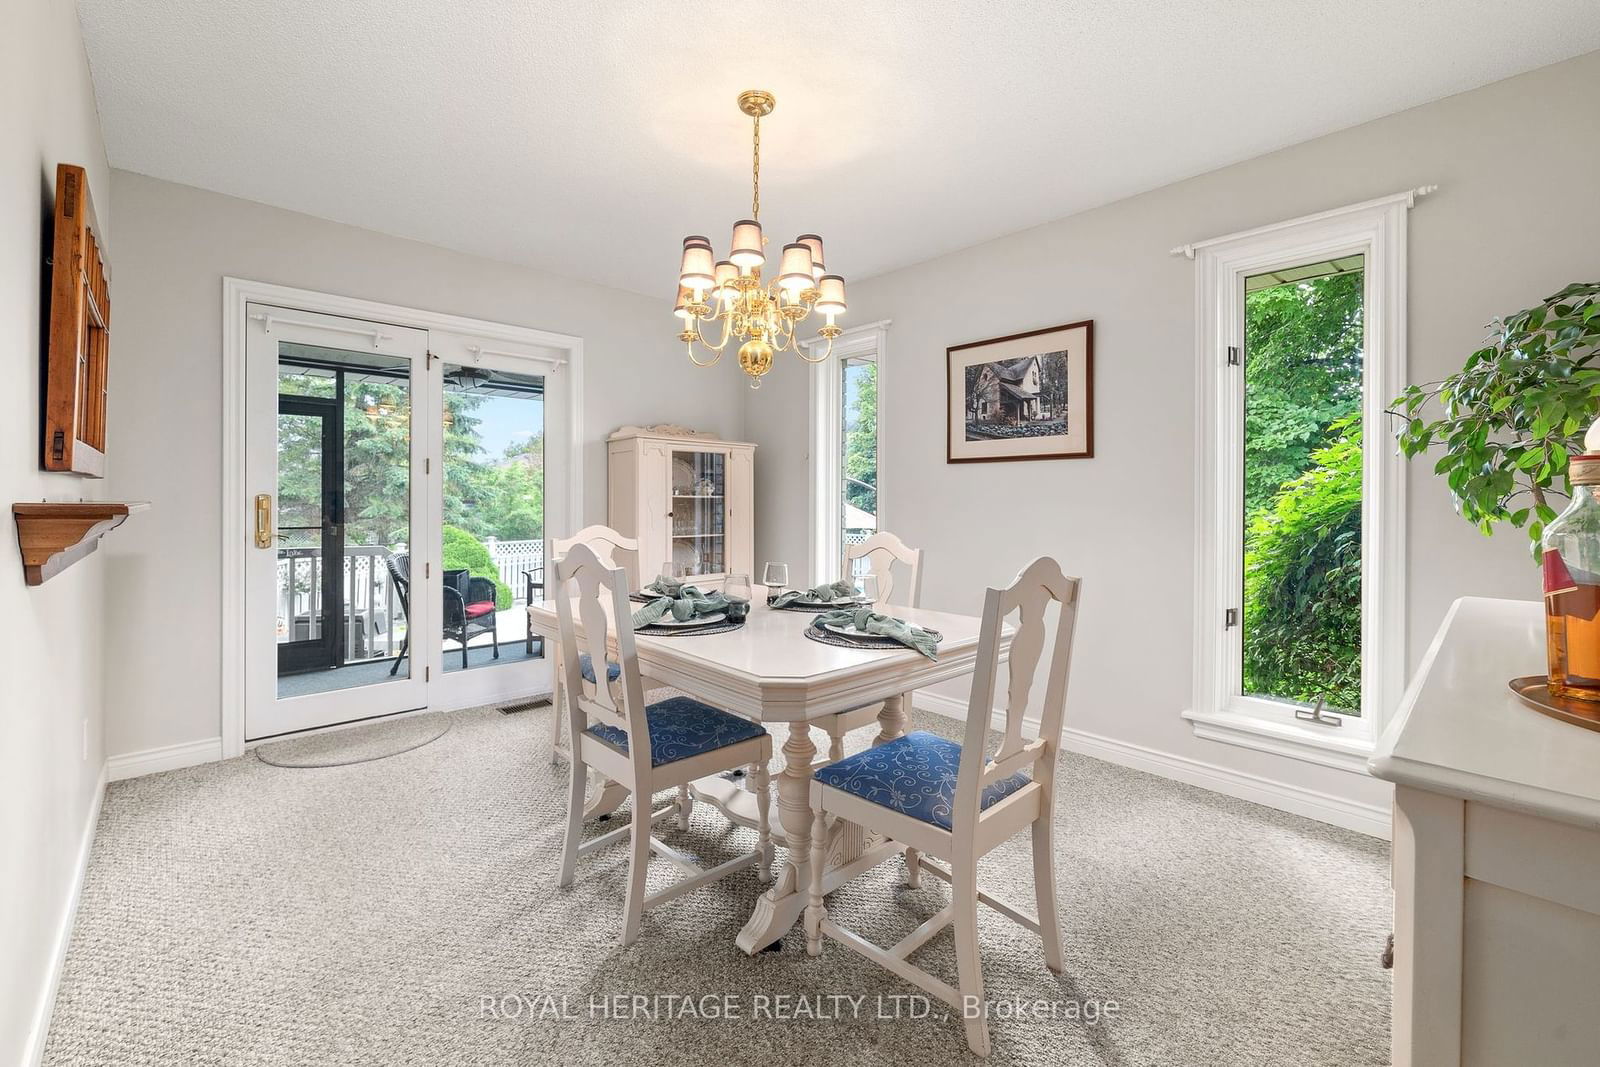
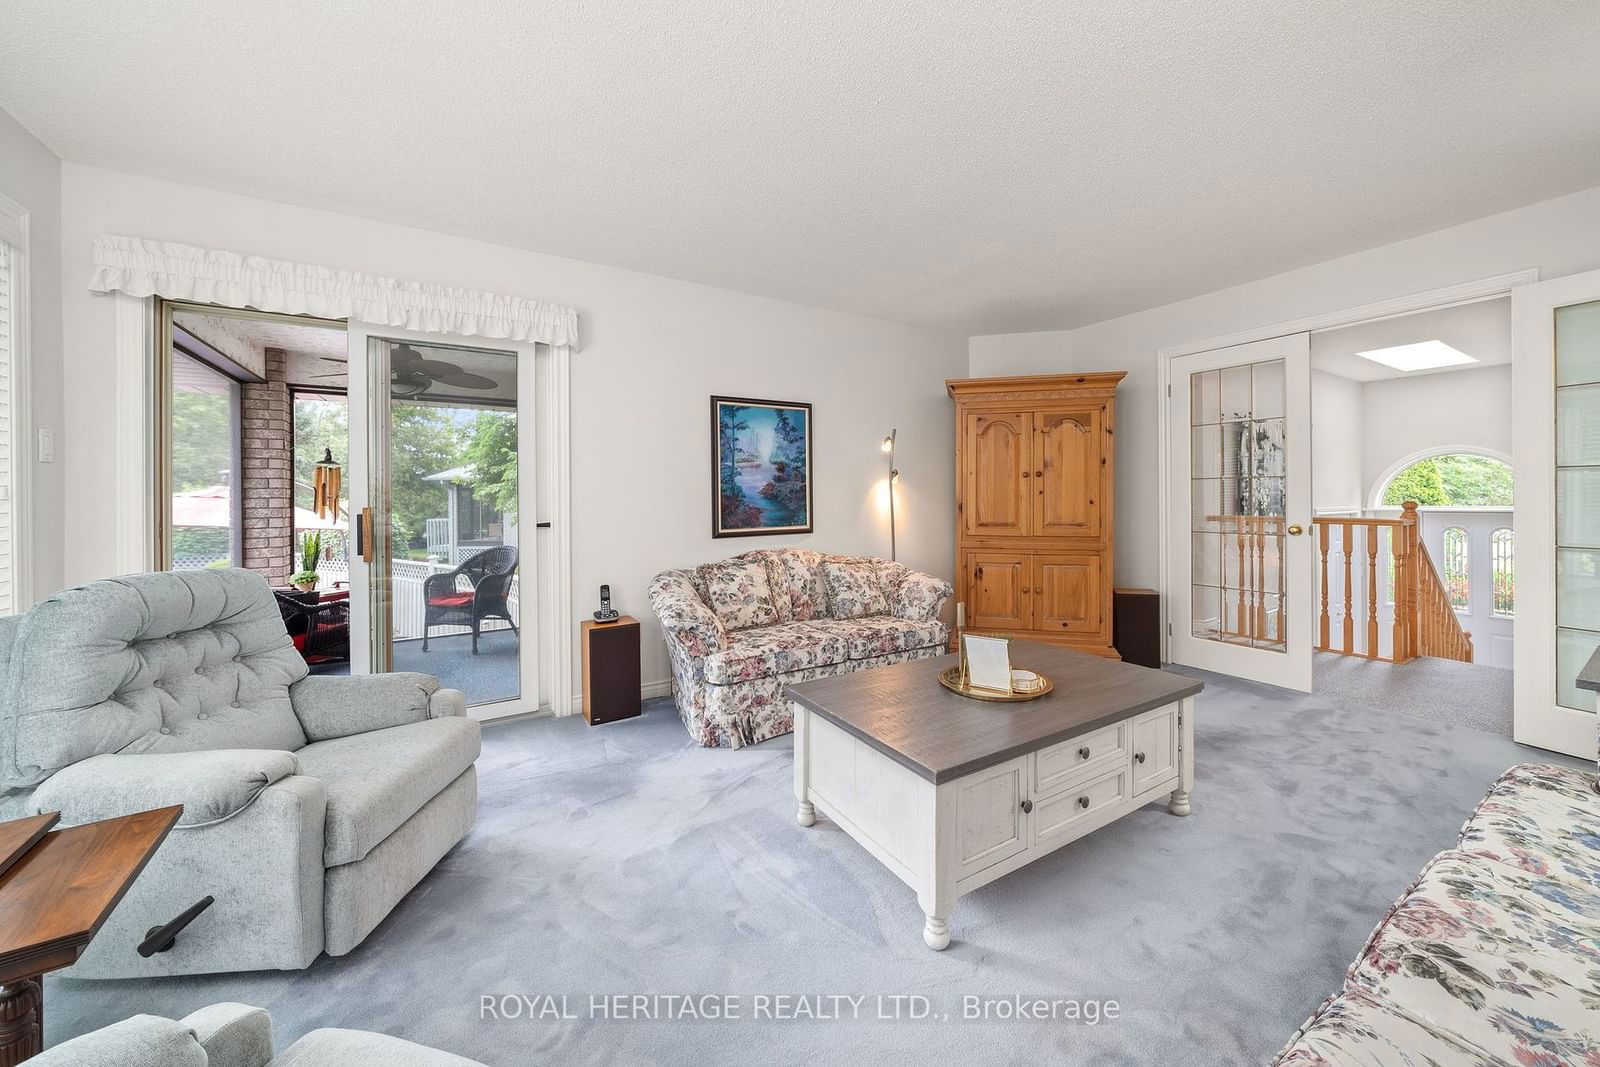
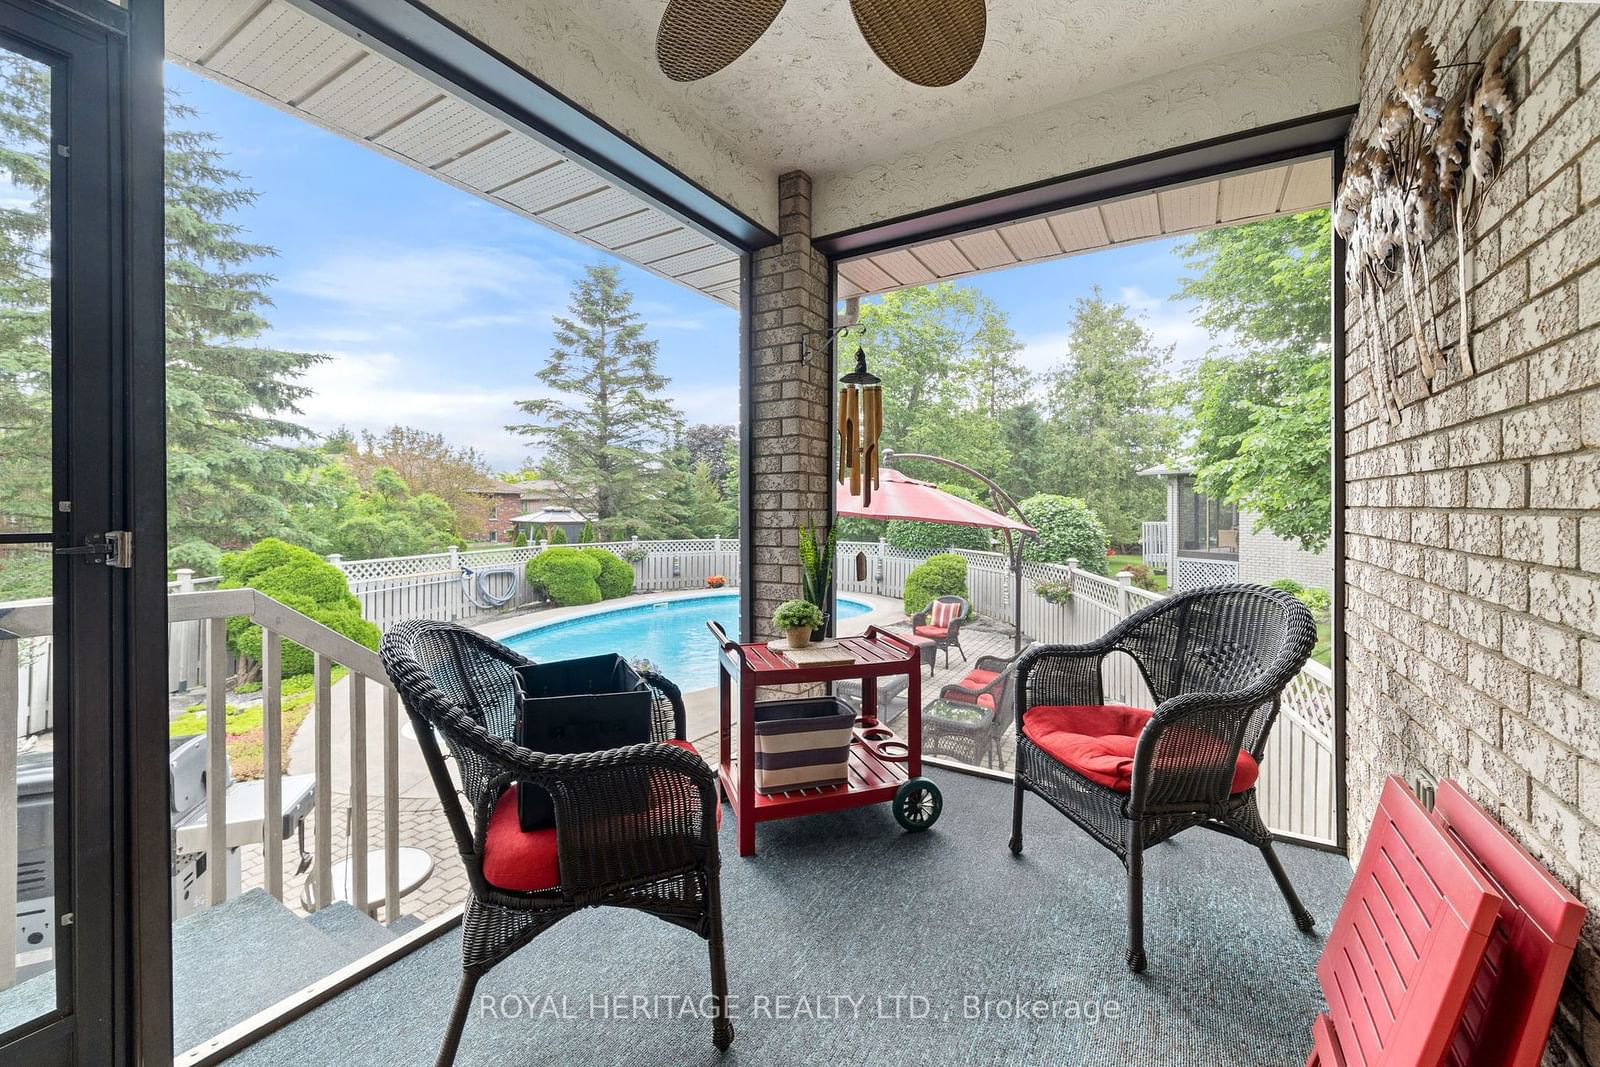
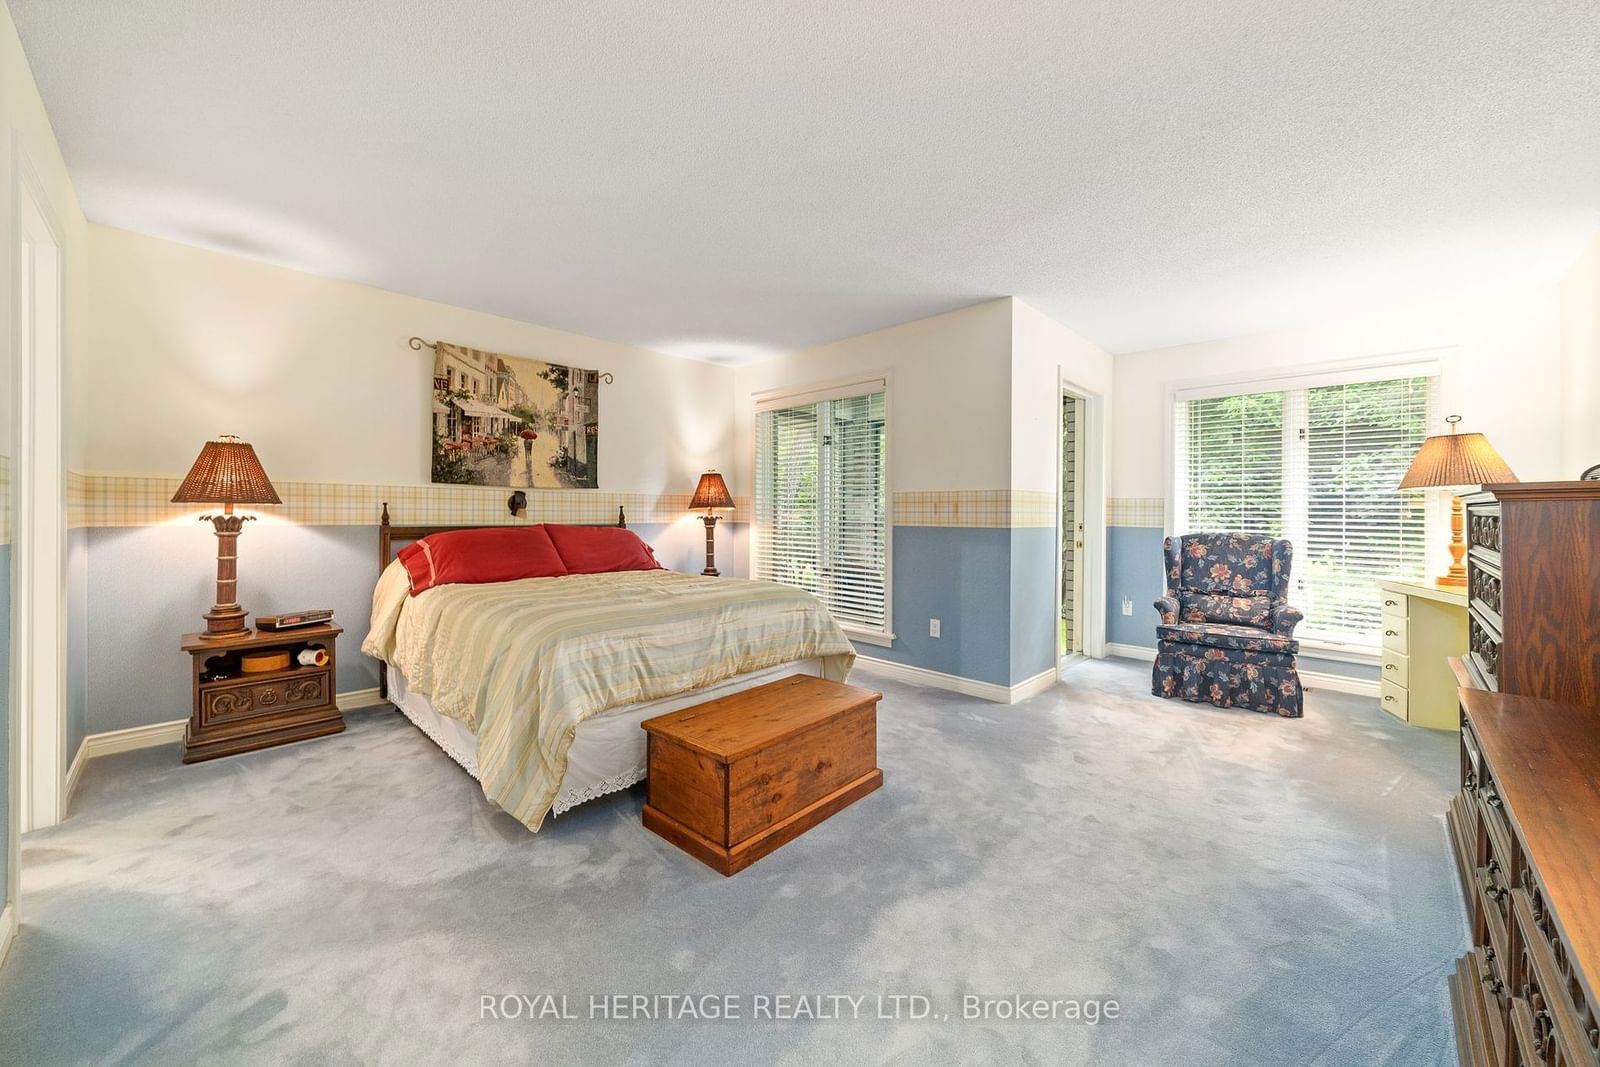
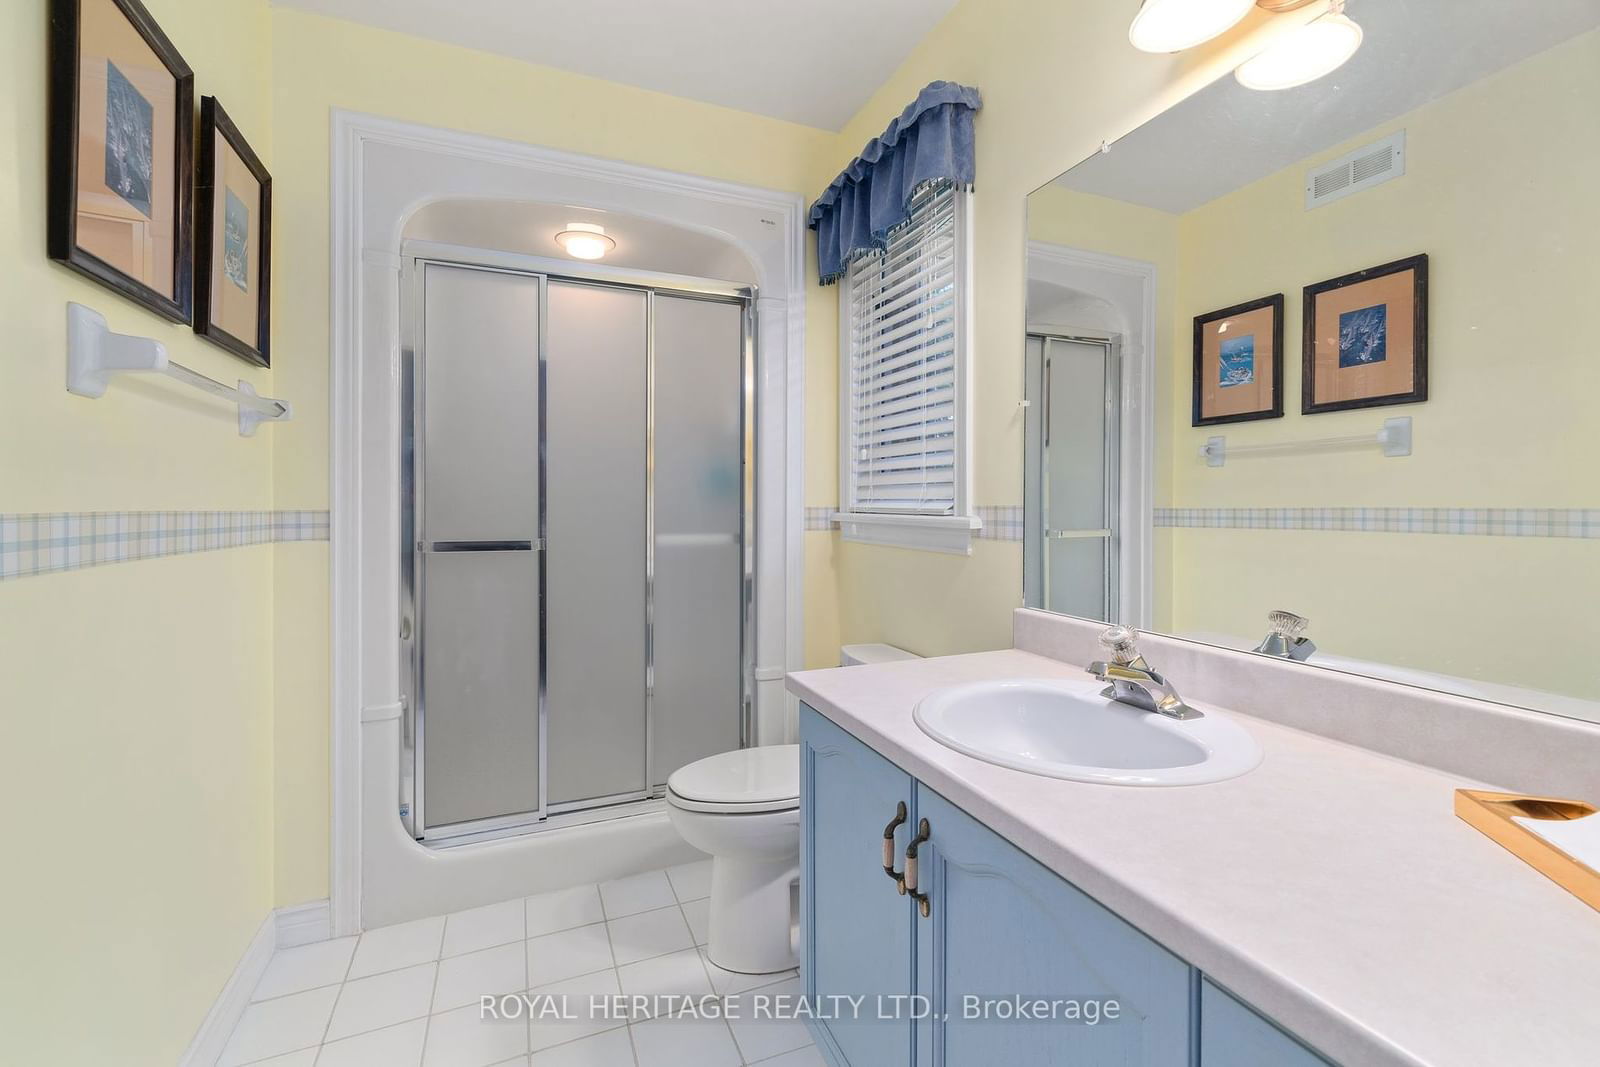
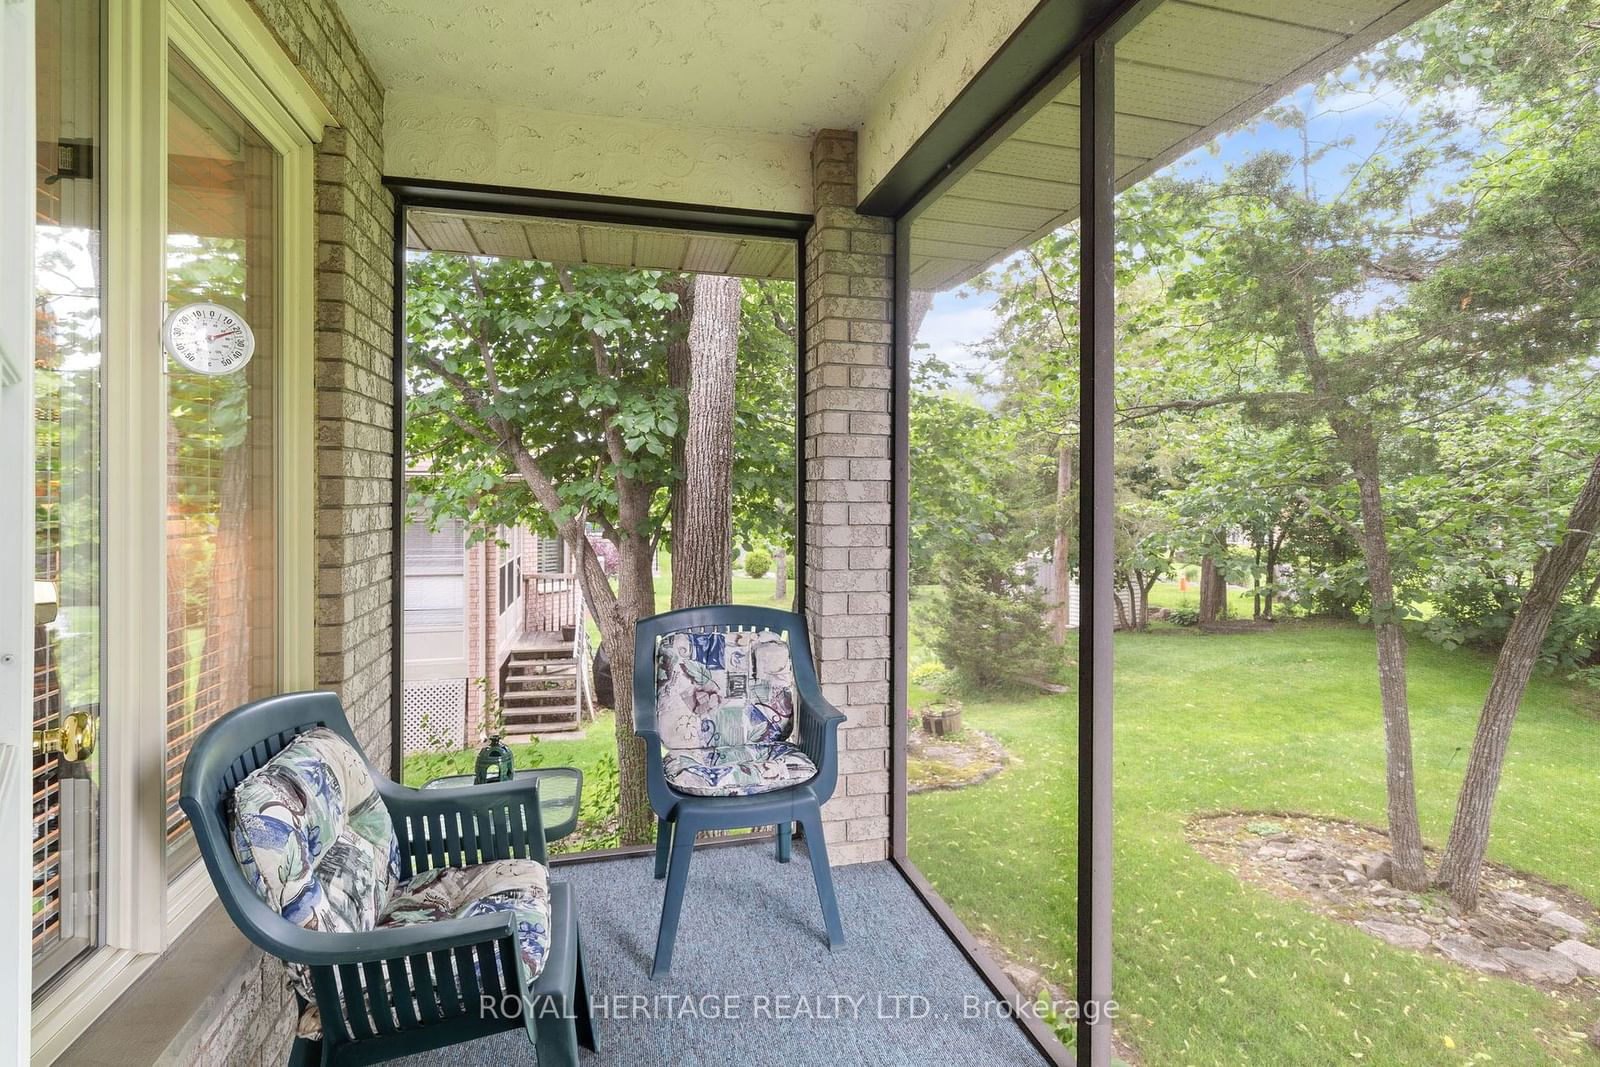
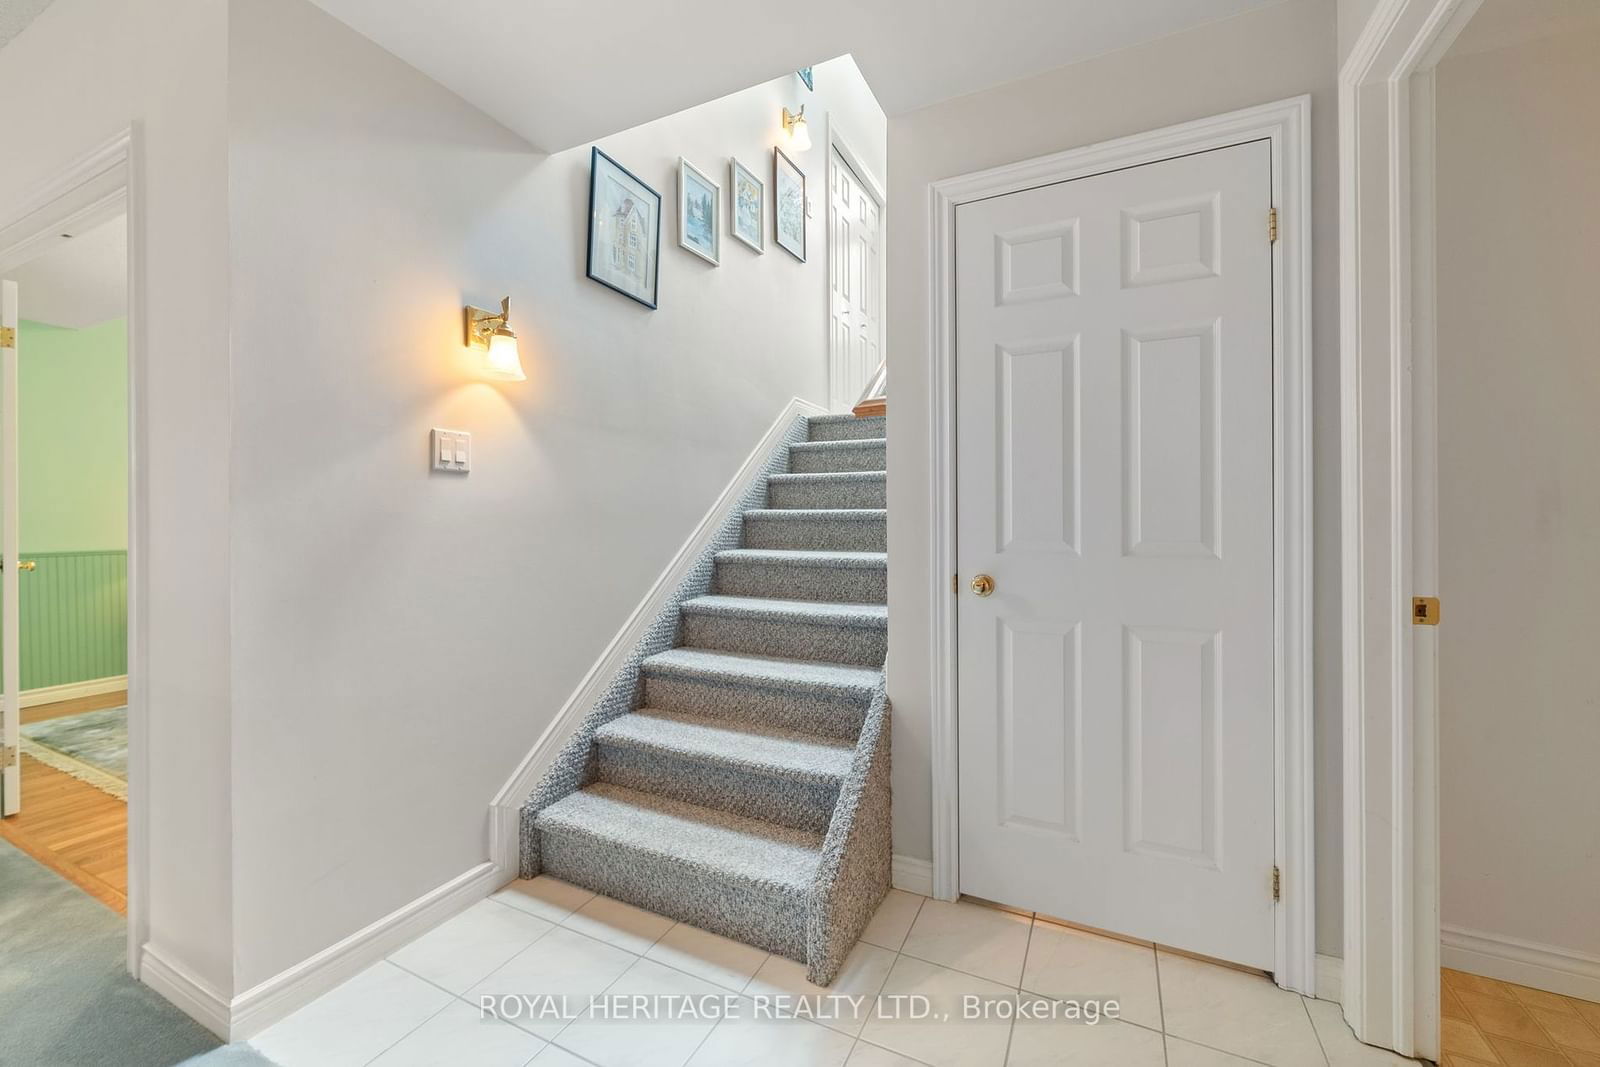
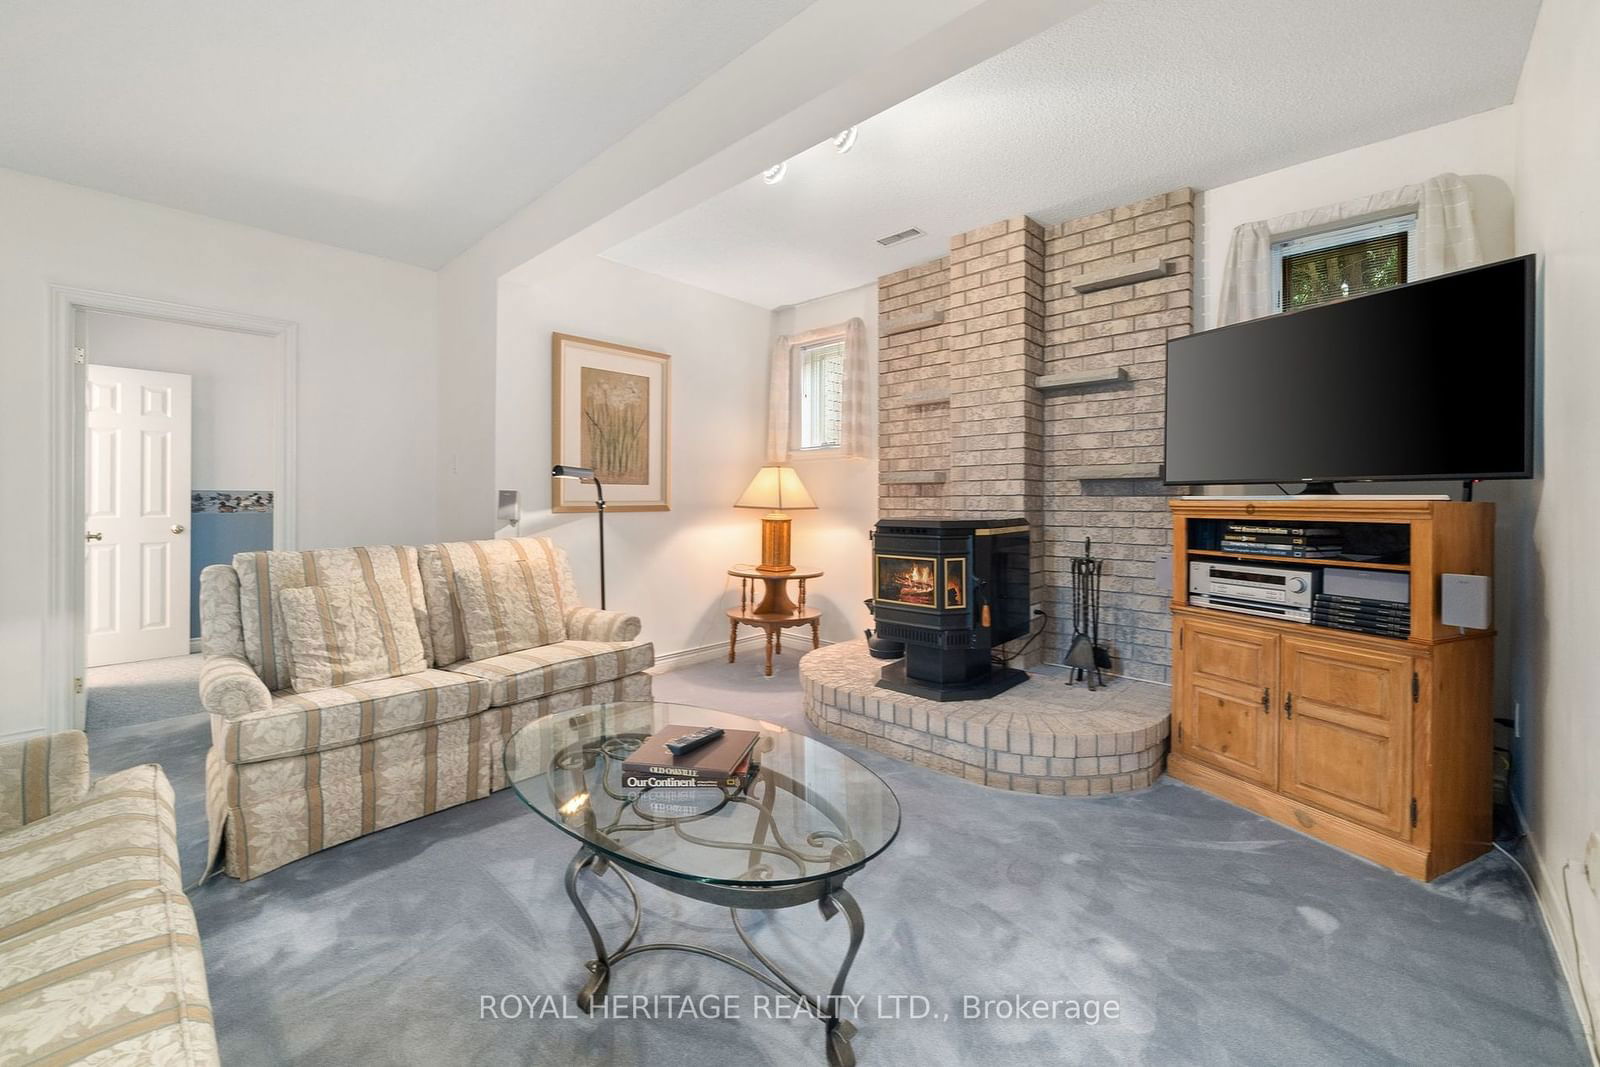
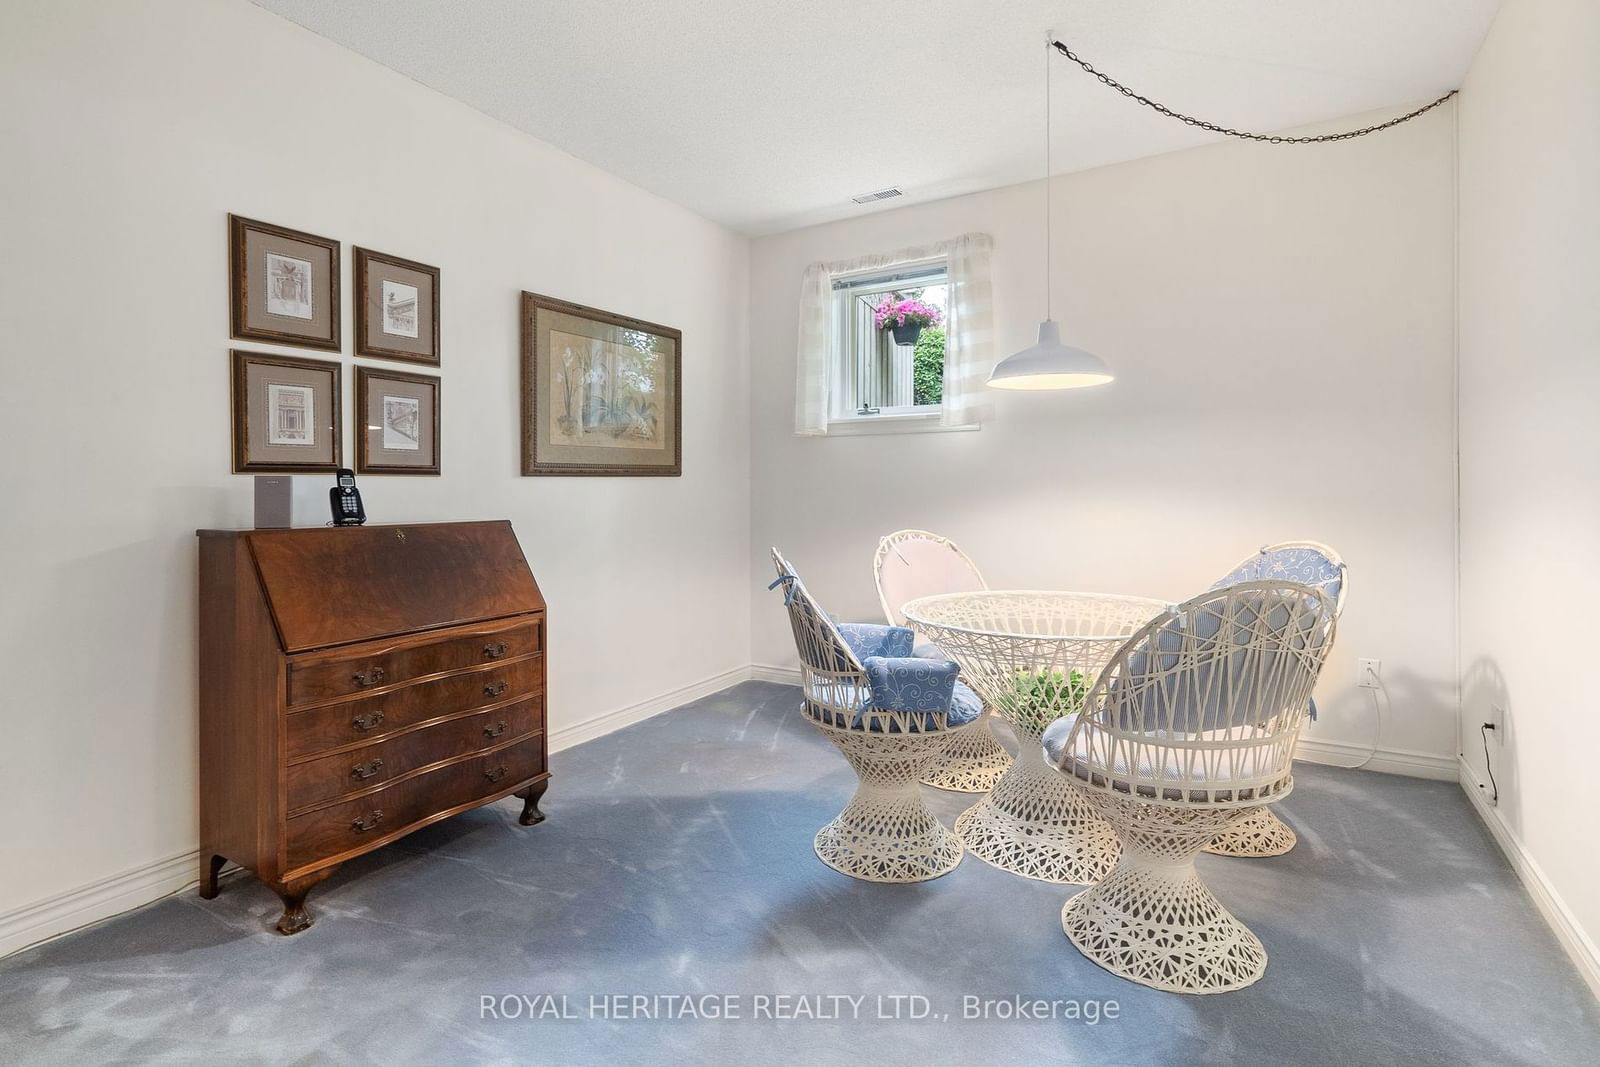
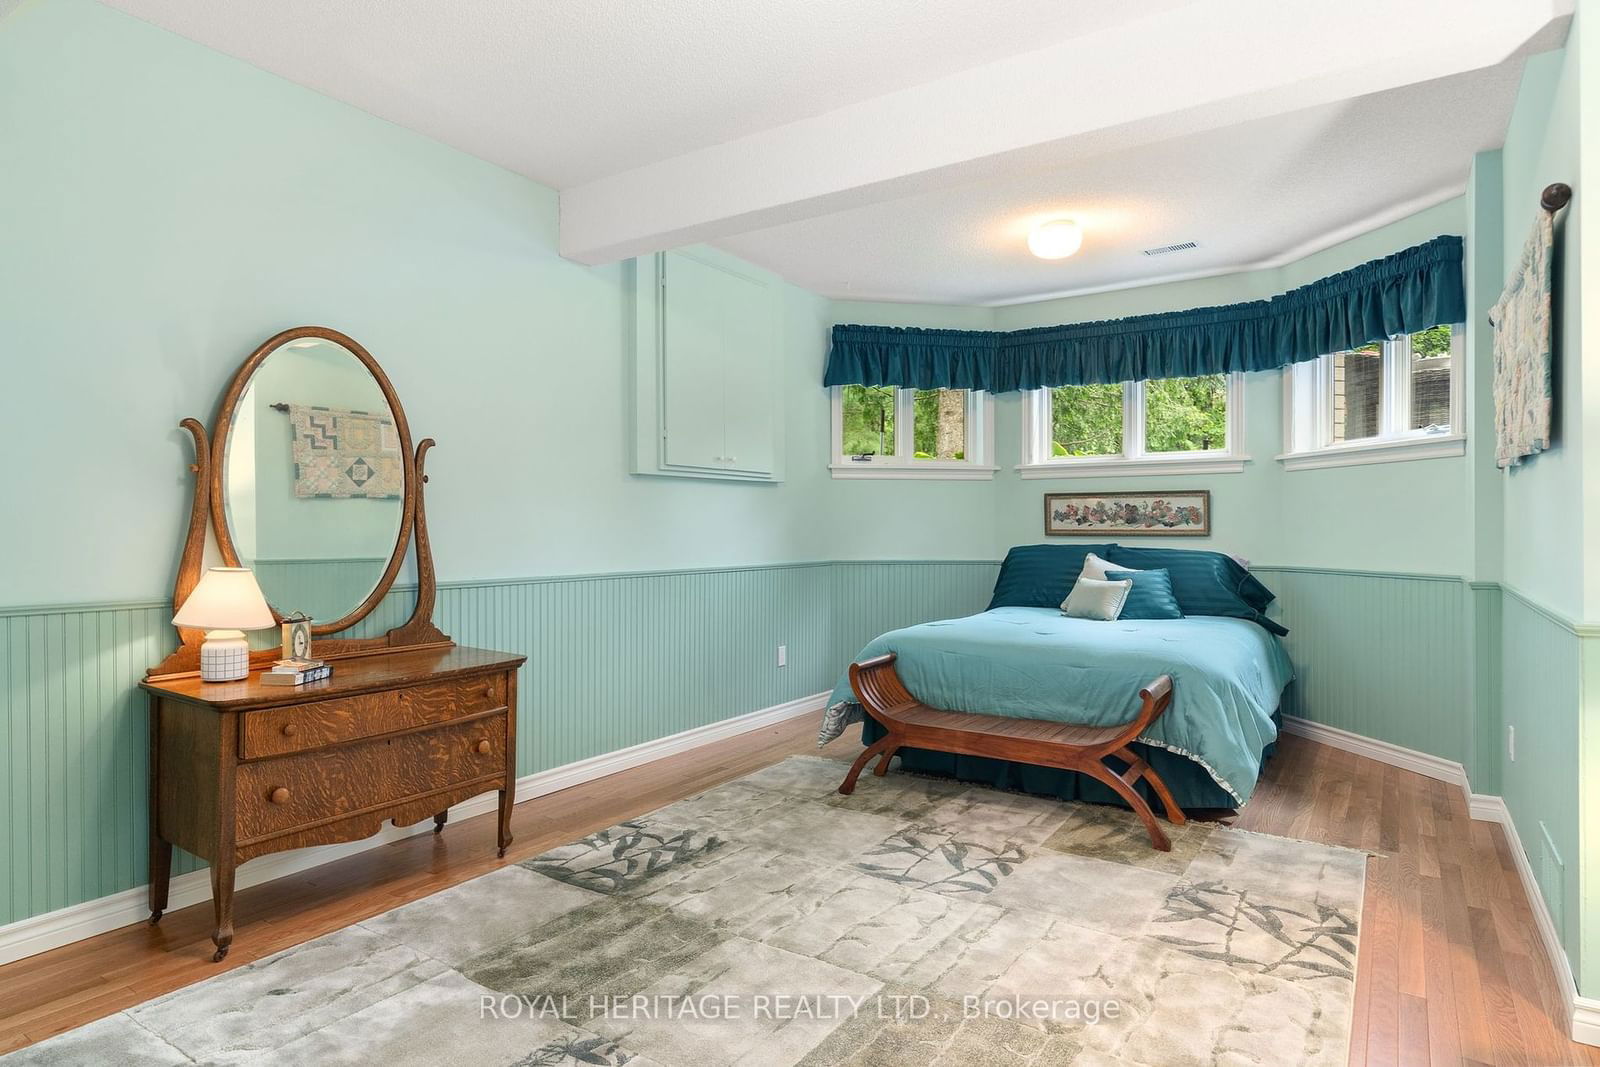
Curb Appeal when you pull up & beautifully landscaped rear yard featuring an inviting Kidney shaped "Stirling" inground pool. Spacious 4 bedroom / 3 bath home featuring M/F w/updated Kitchen, formal Living and Diningroom, 4 pc. bath, King Sized Primary suite w/3 pc. ens. & W/I closet & private Lanai & second bedroom. Lower level boasts extra high ceilings, an open concept Family / games room (Pellet Stove), 3rd bdrm w/3 pc. semi ens., a massive fourth bedroom and a convenient laundry/storage/utility space. As a member of Shore Spa you can head to the Club with friends, this active adult waterfront community is located on the Shores of Pigeon Lake providing access to the Trent Severn System and miles of water sport enjoyment.
Dir: Hwy # 36 to Mill St, left on Squires Row, right at Island Bay follow to 68
Laundry
Kitchen
Dining
Living
Bathroom
Prim Bdrm
Bathroom
2nd Br
Family
3rd Br
4th Br
Bathroom
The graph below compares the average list price and average sale price of homes in this neighborhood by month for the last 24 months. When average sale price is greater than average list price, this may suggest a buyer's market. When average sale price is lower than the average list price this may suggest a seller's market.
The graph below illustrates the average days on market for homes in this neighborhood. The yellow area may indicate a buyer's market, the green area may indicate a balanced market and the red area may indicate a seller's market.
Sales Representative, Century 21 People’s Choice Realty Inc., Brokerage
(647) 576 - 2100
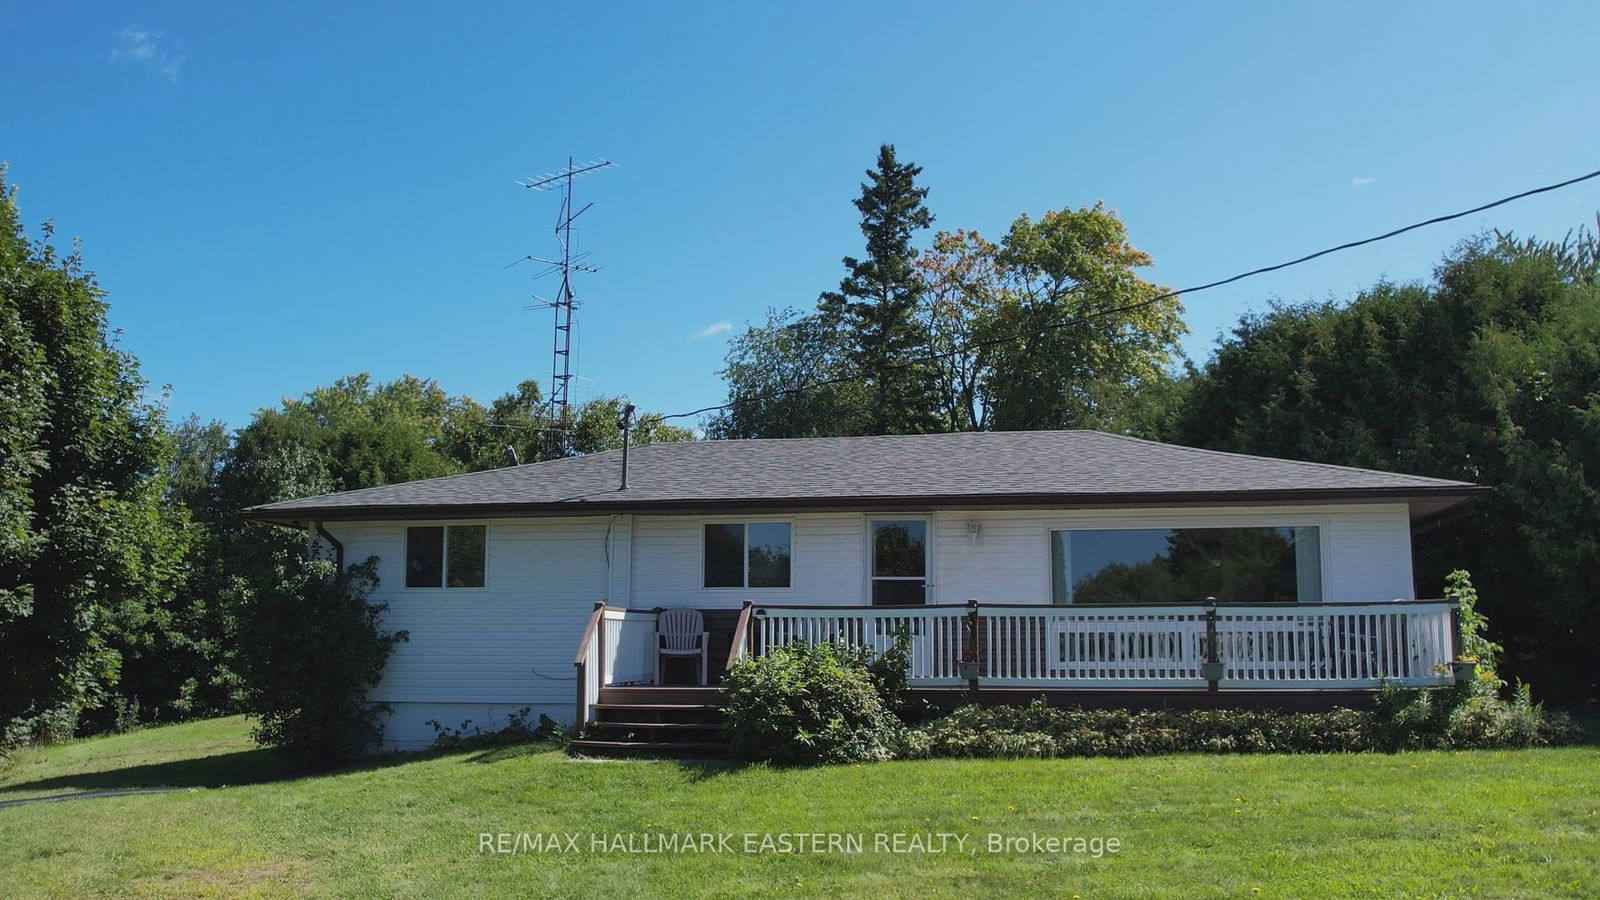
Smith-Ennismore-Lakefield, Rural Smith-Ennismore-Lakefield, K0L 1T0
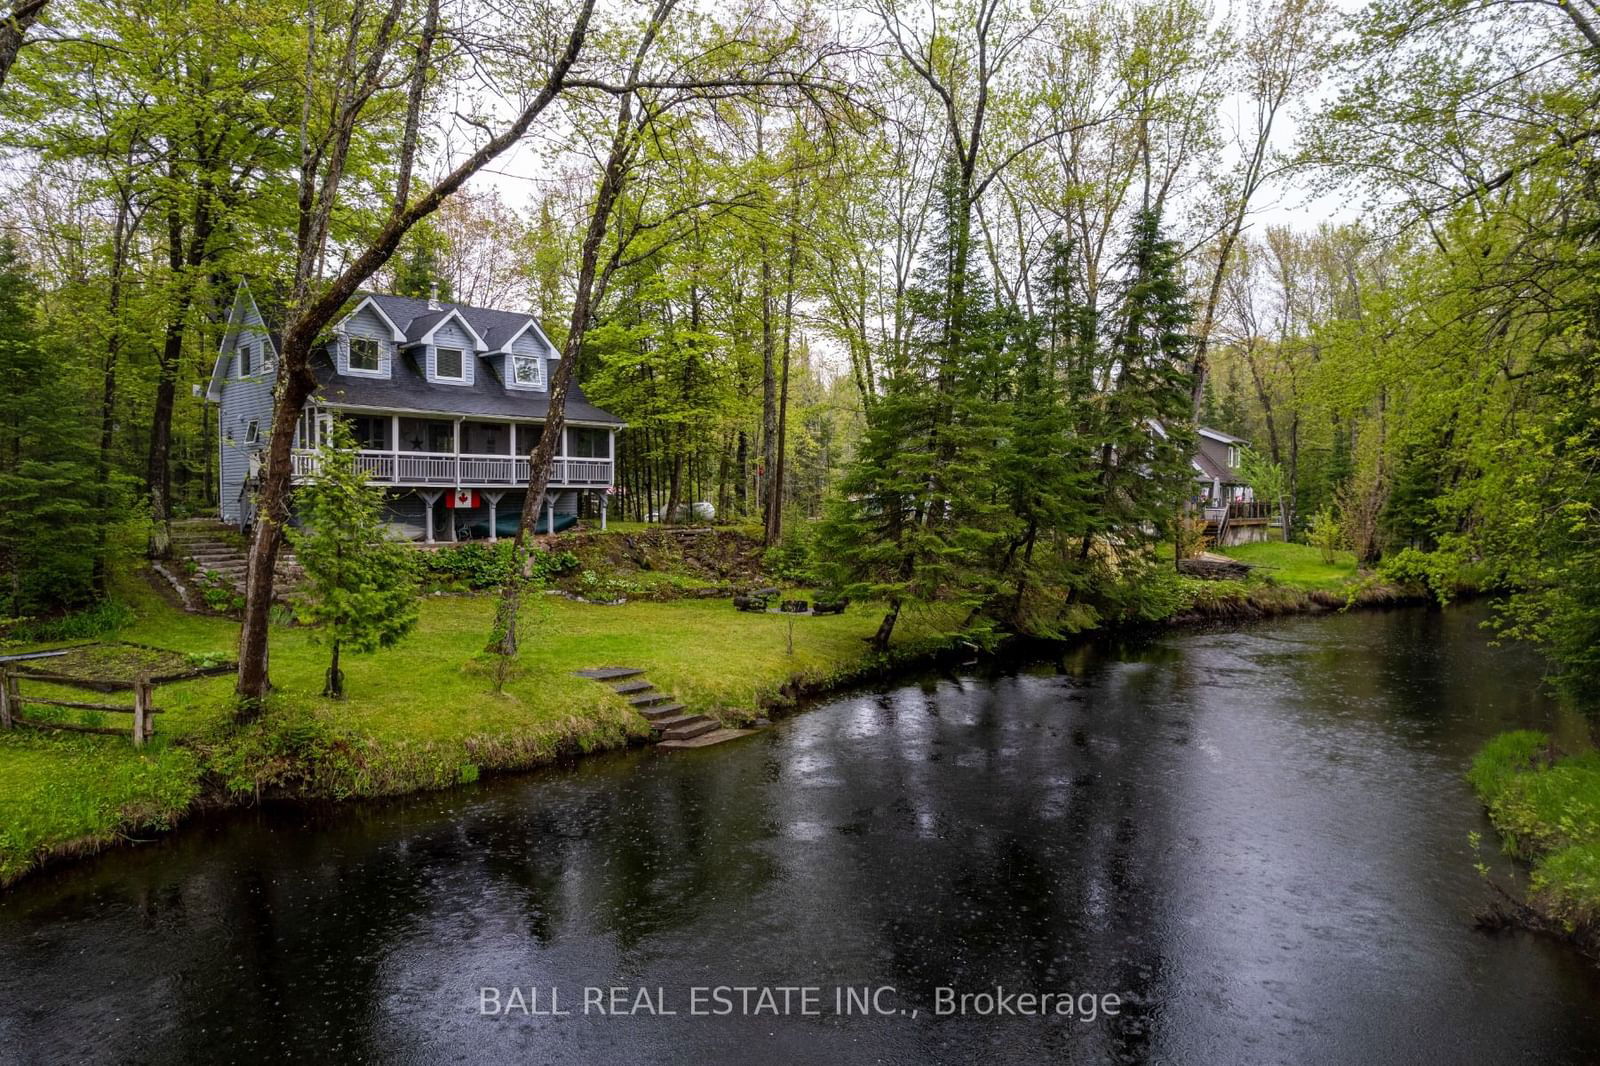
Galway-Cavendish and Harvey, Rural Galway-Cavendish and Harvey, K0M 1A0
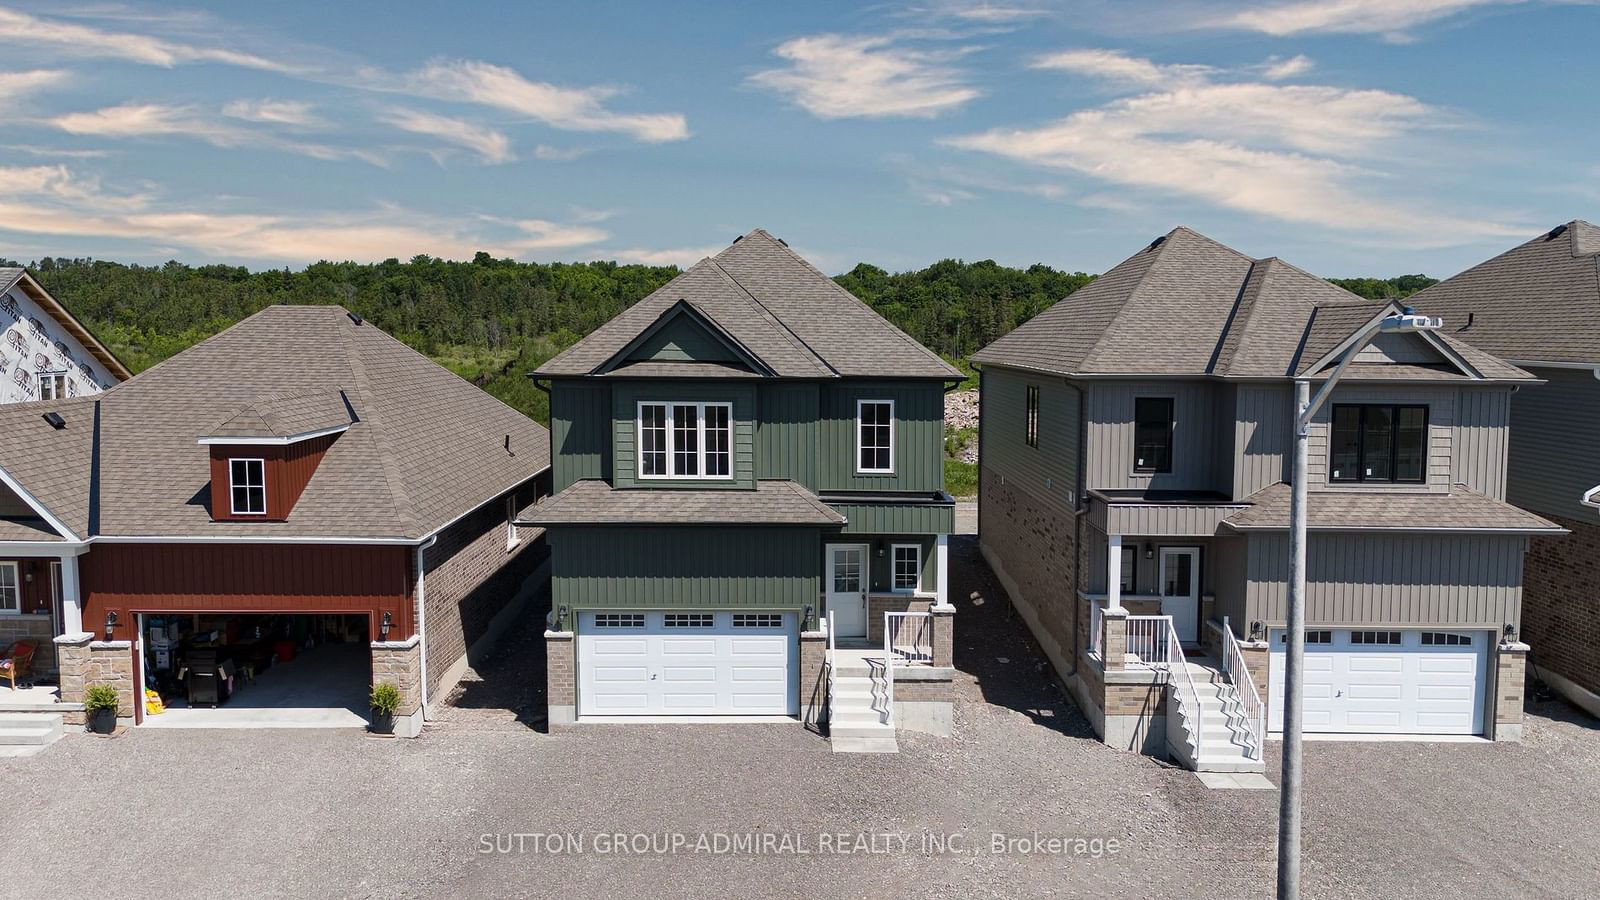
Galway-Cavendish and Harvey, Rural Galway-Cavendish and Harvey, K0M 1A0